A healthy-looking Google Ads return can still hide an unprofitable campaign. Measuring Google Ads ROI means looking beyond revenue and ROAS to account for the costs that determine net profit. New campaigns need time to gather conversion data: allow 2-4 weeks for initial learning and 60-90 days of optimisation to assess whether performance is stabilising and producing reliable ROI data.
It’s understandable to want a clear answer quickly, especially when every click uses part of your marketing budget. But conversion tracking, lead quality, sales outcomes and business costs all affect the result. Revenue alone cannot show whether advertising is contributing to profit.
This article explains how to track conversions, calculate ROI and distinguish it from ROAS. It also explores how results vary by business type, when campaigns may show meaningful performance, and how the data can guide focused improvements.
Reliable ROI measurement starts by recording the actions that matter to a South African business. Google Ads conversion tracking connects ad interactions with those outcomes, giving performance analysis a stronger foundation than click totals alone.
Conversion tracking records valuable actions after an ad interaction, while micro-conversions capture meaningful steps towards those outcomes. Choose actions that match the business goal, such as a completed purchase, qualified enquiry, phone call or appointment booking. For an auto repair shop, calls from an ad, calls after an ad click, contact form submissions and completed booking forms can all count as conversions.
Google Ads provides a free conversion tracking tool to measure how many clicks lead to conversions. You can also connect Google Ads with Google Analytics to understand campaign activity across channels. This helps distinguish a completed sale from an early signal, such as a form start, so minor interactions don’t inflate the value assigned to advertising.
Conversion rate is total conversions divided by total clicks, multiplied by 100. Cost per acquisition (CPA) is total ad spend divided by total conversions; cost per lead uses total advertising spend divided by the number of leads. These measures answer different questions: conversion rate shows how often clicks lead to action, whilst CPA shows the spend associated with each recorded outcome.
For South African reporting, keep revenue, advertising spend, conversion values and VAT treatment consistent. If sales or costs are in another currency, record the exchange rate used to convert them into Rand rather than mixing currencies in one calculation. Use actual local transaction values for conversions, not assumed values that obscure what the business earned.
Conversion benchmarks also depend on the service and the action being measured. Legal and healthcare industries often have search conversion rates above 6%, but that figure isn’t a universal target for South African service businesses. A professional compares like-for-like actions and considers whether enquiries become qualified leads, appointments or paying customers.
Attribution assigns credit to advertising interactions that contribute to a conversion, while profitability analysis checks whether the resulting value exceeds its costs. A Google Ads attribution window may be 30 or 90 days; conversions outside the chosen window aren’t counted. Professionals consider multi-touch attribution when several advertising touchpoints influence a customer journey.
For revenue measurement, set up conversion tracking for a purchase or revenue event. When a sale happens offline, such as after a phone enquiry or in-person visit, offline conversion tracking can connect the outcome to the earlier ad interaction. A CRM can link campaign activity with revenue, lead quality and customer lifetime value. Together, these records make cost per conversion more useful: the key question is not just how many actions occurred, but whether they produced profitable business.
ROAS compares ad-attributed revenue with advertising spend, while ROI measures profit against investment. To compare Google Ads with other marketing channels, assess each using consistent attribution, time periods and cost calculations.
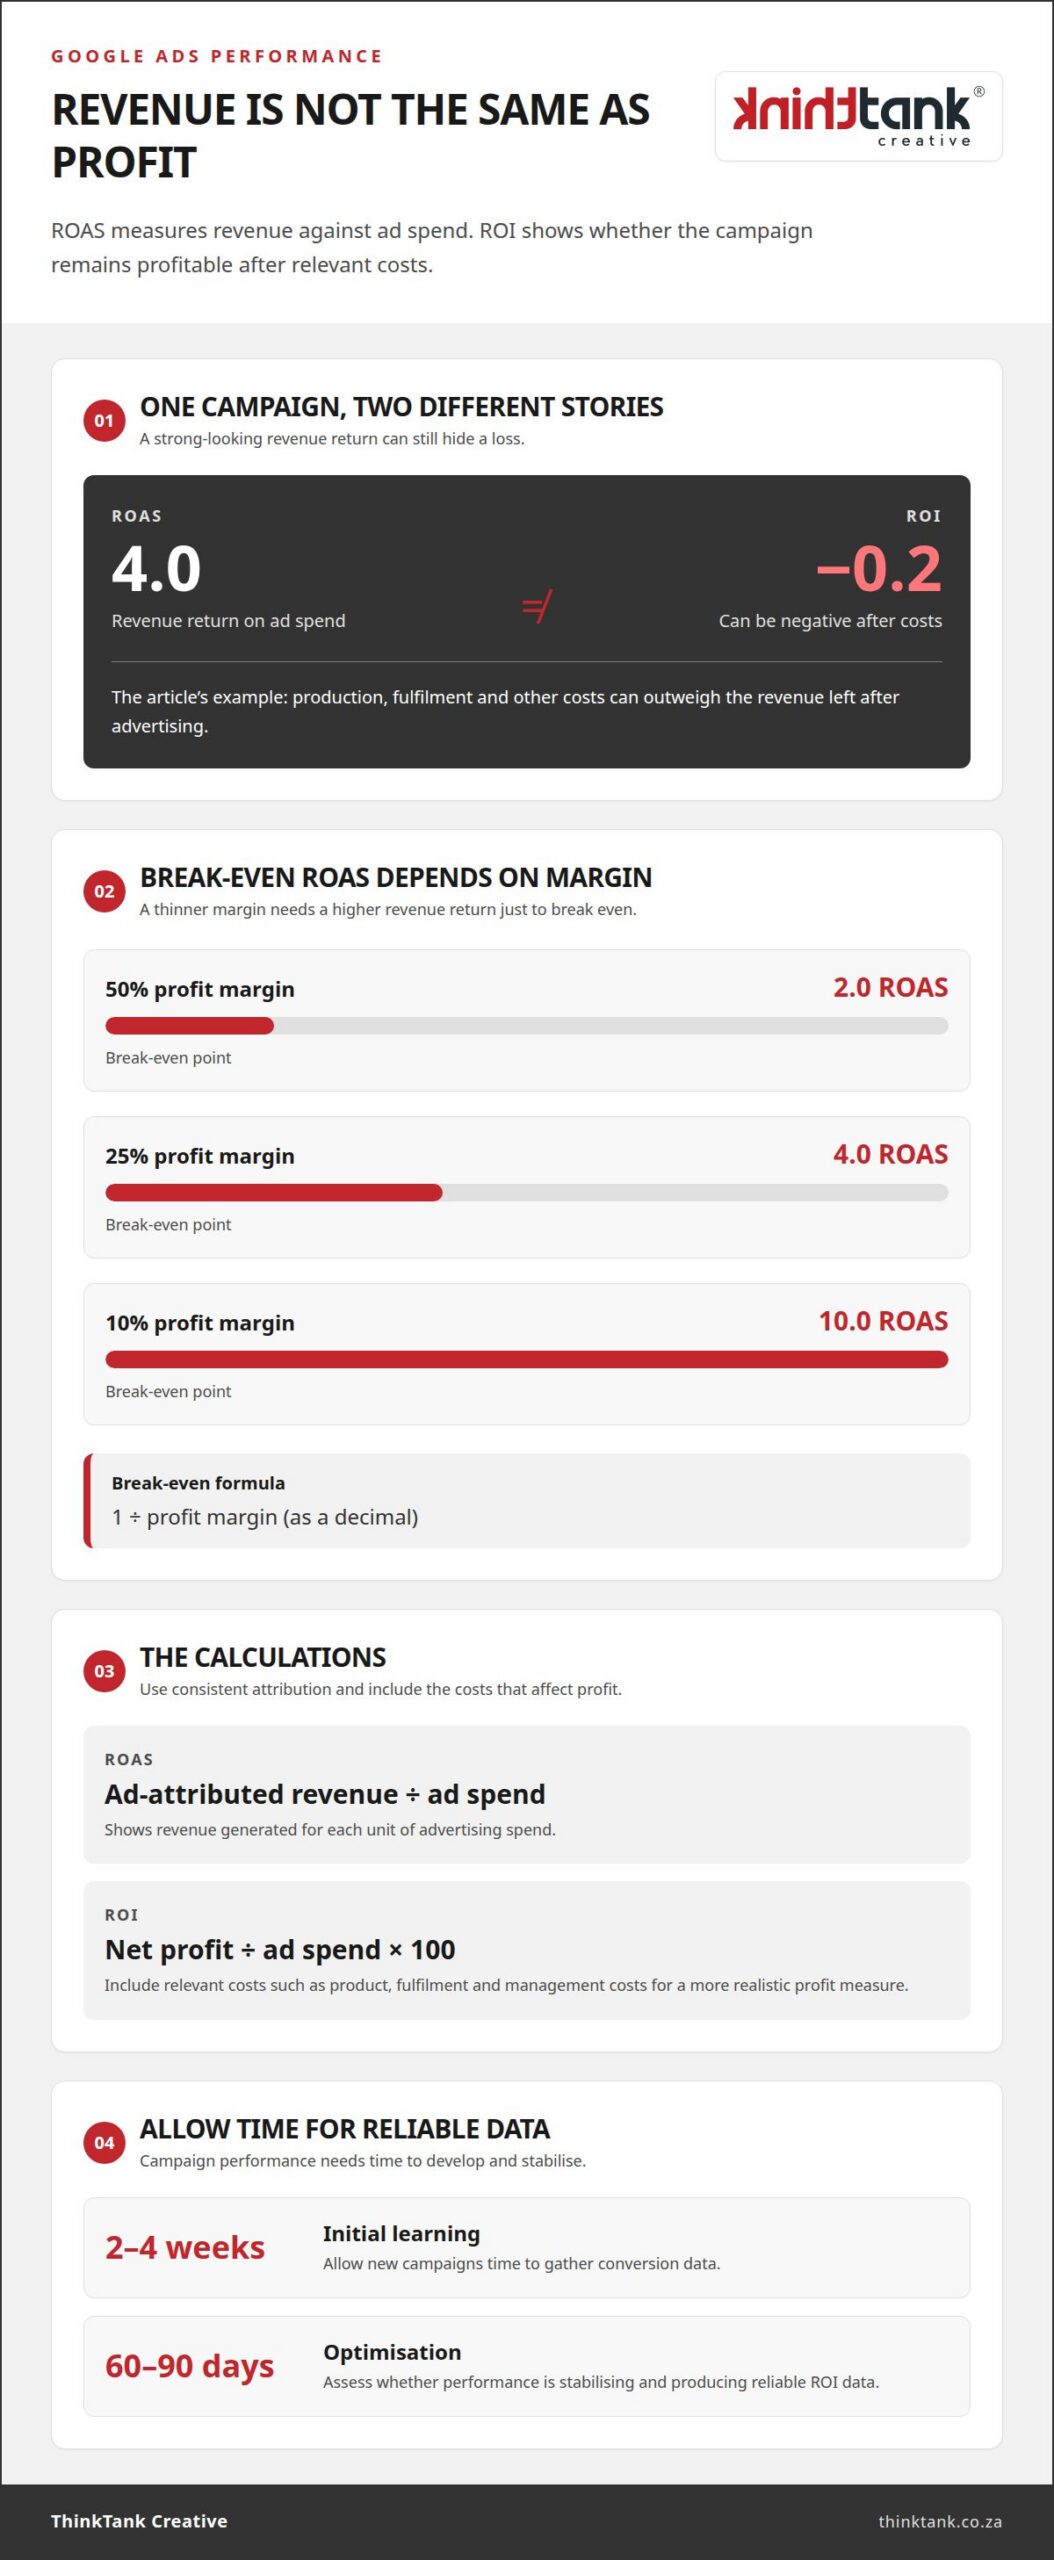
ROAS shows how much revenue advertising generates for each unit of ad spend. Profit-based ROI asks whether the campaign earns more than its attributable costs. A 4.0 ROAS can still produce a -0.2 ROI when production, fulfilment and other costs outweigh the revenue left after advertising.
These metrics answer different business questions. ROAS helps compare revenue efficiency between campaigns, while ROI indicates whether the investment creates profit. Clicks and attributed sales describe activity, but they don’t show the full return unless you also account for costs and profit margins.
Break-even ROAS is the revenue-to-ad-spend ratio needed to cover advertising costs at a given profit margin. Calculate it by dividing 1 by the profit margin expressed as a decimal. At a 50% margin, a 2.0 ROAS breaks even; at a 25% margin, break-even rises to 4.0.
A 10% margin requires a 10.0 ROAS to break even. The same revenue return can therefore mean profit for one business and a loss for another. Use the margin on the revenue driven by ads, rather than treating a general ROAS benchmark as a profit target.
For ROAS, divide revenue attributed to ads by ad spend. For ROI, divide net profit by ad spend, then multiply by 100. A professional includes relevant costs when calculating net profit, so the result reflects more than the sales value recorded against campaign clicks.
Related metrics add context. CPA is the cost of acquiring a customer or lead; AOV means average order value. LTV estimates customer value over their relationship with a business, using average purchase value, purchase frequency and customer lifespan. A higher CPA may be viable when LTV supports it.
Compare channel returns on equivalent terms: use consistent attribution rules, conversion values and cost coverage for Google Ads, social media and email. A channel’s reported revenue can reflect different customer journeys, so assess the profit it contributes, not just its attributed sales. For a more joined-up view, consider campaign performance analysis.
Campaign optimisation works best when you compare meaningful results over time, not isolated clicks. In South Africa, that means balancing growth opportunities with cash flow and the campaign’s actual goals.
A baseline is a campaign’s starting performance, assessed against its previous 3-6 months of data where available. It gives professionals context for changes in conversions, costs and revenue, rather than judging an adjustment against a single day. Industry benchmarks add perspective, but they can’t replace a business-specific comparison.
For example, retail search conversion rates average around 2.8%. That figure is a reference point, not a target for every South African online shop. A professional compares similar products, customer journeys and conversion actions, then considers whether the landing page reflects the ad’s promise and supports purchases.
Analytics can show where performance changes: by campaign, device, location, time of day or creative. You can adjust bids towards stronger segments, exclude irrelevant searches with negative keywords, and align each landing page with search intent. These changes connect observed behaviour with practical optimisation decisions.
A learning period gives a new campaign time to gather conversion data before performance is judged. Allow at least 2-4 weeks for that data to accumulate, then assess whether changes are improving outcomes. Reliable ROI often needs a longer view: campaigns may take 60-90 days to stabilise and produce dependable results.
This timeline matters for cash flow. A business should account for advertising spend during the learning period, while avoiding abrupt budget changes that make results harder to interpret. Once a campaign has meaningful data, professionals can adjust budgets gradually, such as increasing spend by 10-20% every few days whilst monitoring performance.
Compare campaign results with the agreed business goal, such as qualified enquiries, purchases or revenue. Consider both volume and value: a campaign producing more leads may still underperform if few progress to sales. CRM outcomes can help connect campaign activity with lead quality and revenue.
Goals also guide which optimisation matters. For online commerce, the focus may be purchase value and profitable growth; for lead generation, it may be qualified enquiries and their eventual contribution to sales. Segment performance by campaign and creative so budget decisions reflect which activity supports the intended outcome.
When a campaign falls short, investigate the evidence before changing direction. You might test ad copy or landing-page variations, review device and location performance, or refine targeting. A controlled test isolates the change, making it easier to tell whether it improved conversions or simply shifted clicks.
Use each review to make a clear decision: retain what meets the goal, refine weak points and keep testing where evidence is limited. This measured approach helps protect cash flow while making room for sustainable growth.
For lead-generation campaigns, connect Google Ads spend with qualified enquiries, sales and revenue. Measuring Google Ads ROI means assessing the profit those results contribute after relevant costs, not treating every recorded lead as a completed sale.
Revenue is the Rand value of sales attributed to advertising; net profit is what remains after relevant costs are subtracted. This distinction shows whether campaign-generated business contributes profit after delivery and operating expenses.
A professional connects campaign records with sales data, then accounts for costs such as goods or service delivery, fulfilment and allocated overhead. Payment processing fees may also affect the result; one calculation approach uses a 2-3% allowance of revenue. Consistent cost categories make comparisons across campaigns more meaningful, because each result reflects a similar view of what it took to generate sales.
Lead-generation revenue requires a link between enquiries and completed sales. If one sale results from every 10 leads, professionals use actual sales records and the value of those sales to assess the revenue associated with the leads. CRM data can distinguish qualified prospects from enquiries that do not progress, giving the ROI calculation a clearer commercial basis.
Calculate ROI by dividing net profit by ad spend, then multiplying by 100. Net profit must account for the advertising cost and other relevant expenses, so the result reflects profit against campaign investment.
For example, a 200% ROI means the net profit equals twice the ad spend under this formula. When measuring Google Ads ROI, a professional examines the underlying sales and cost records before interpreting that percentage. If fulfilment or overhead is omitted, the calculation can overstate the campaign’s contribution.
Keep the reporting period consistent by matching campaign spend with the related revenue and costs. A sale may follow an enquiry later, so use attribution and sales records to connect the transaction with the advertising that contributed to it. This gives you a more useful ROI assessment than clicks or enquiries alone.
Cost per lead is total advertising spend divided by the number of leads. It shows the average campaign spend per enquiry, but does not establish whether those leads become profitable customers.
To assess lead returns, a professional follows the path from ad interaction to enquiry, qualified opportunity and sale. If 10 leads produce one sale, the business’s actual sale value and related costs help determine the profit generated. Measuring Google Ads ROI for lead generation therefore depends on connecting lead quality with later sales outcomes, rather than assigning equal value to every enquiry.
These insights can also guide targeting decisions. A campaign with a lower cost per lead may deliver weaker returns if its enquiries rarely convert, while higher-cost leads may produce stronger sales. Professionals compare lead quality, sales outcomes and spend before adjusting targeting or budgets.
There’s no single return that defines success for every business. A useful benchmark depends on profit margins, customer value, sales cycles and the conversion the campaign is designed to generate.
For direct-to-consumer businesses, a ROAS guideline is 3.0x to 5.0x. This range can help frame campaign performance, but it doesn’t establish profitability by itself. Product costs, delivery expenses and other operating costs affect how much revenue remains as profit. A South African retailer should assess its own margins before treating a return in this range as a success.
E-commerce guidance also gives a 2.75x ROAS benchmark. That figure differs from the direct-to-consumer range because benchmarks can use different assumptions and business models. Rather than combine them into one target, a professional identifies the closest comparison, then considers the store’s average order value, repeat purchases and costs.
Business-to-business campaigns have a wider ROAS guideline, from 4.0x to 10.0x, depending on sales cycle and conversion value. A longer sales process can mean that a click or enquiry takes time to generate revenue. Campaign analysis should connect the keyword and audience to qualified opportunities, then follow those opportunities through to sales.
Service businesses also need to judge lead quality, not just enquiry volume. Optimised campaigns for service businesses can exceed 200% ROI when focused on lead quality. That isn’t a universal result: the return depends on how many leads become customers, the value of each sale and the costs involved. A strategy that captures more suitable enquiries may contribute more than one generating a larger number of unqualified leads.
Results can vary widely across digital product campaigns and businesses, so benchmarks should be treated as context rather than a promise. These figures offer context, not a promise or a target for every South African advertiser. Differences in margins, sales journeys and customer value make direct comparisons unreliable unless the calculations use comparable costs and attribution.
Use benchmarks to ask better questions: does this campaign attract the right audience, generate valuable conversions and support profitable growth? A professional can compare results with the business’s margins and goals, then optimise targeting, keywords and campaign strategy accordingly. For support refining your Google Ads campaign strategy, connect your performance goals with a focused PPC approach.
ThinkTank Creative helps businesses connect campaign goals with the digital experiences customers encounter along the way. If ad clicks lead to a website that doesn’t clearly guide visitors towards an enquiry or purchase, Website Design and Development can strengthen that journey. Social Media Marketing and creative design can also support consistent communication across customer touchpoints.
Consider this support when performance data points to gaps between attracting an audience and helping people take action. A clear website experience and cohesive messaging give your campaigns a stronger foundation for turning relevant visits into meaningful outcomes.
Contact ThinkTank Creative to discuss how your digital experience can better support your marketing goals.
Make campaign measurement part of a wider growth conversation, not just a reporting exercise. A disciplined approach to measuring Google Ads ROI can help your team decide where to focus, which parts of the customer experience need attention, and how advertising supports your business priorities.
ThinkTank Creative can help shape that wider digital experience through Website Design and Development, Social Media Marketing and creative design. These capabilities support a consistent journey from the first interaction to the point where a potential customer takes action. Discuss how your campaign objectives and customer experience can work together.
Discuss your campaigns with ThinkTank Creative and explore a considered path towards your marketing goals.
Allow time for reliable conversion data before judging a campaign’s return. New campaigns may need 2-4 weeks to gather data, while 60-90 days can provide a better view of stabilising performance. The timeline depends on how quickly clicks turn into trackable sales or qualified leads. A long sales cycle can delay visible revenue, so early results may not reflect the campaign’s eventual contribution.
It can be acceptable if later customer value is supported by actual purchase and retention data. For example, a 1:1 ROAS may be acceptable when a customer is expected to generate four times as much revenue over time. However, future revenue isn’t the same as profit: consider the cost of serving repeat purchases and the time required to earn them before treating an initial loss as sustainable.
Common mistakes include counting every enquiry as a sale, relying on revenue without accounting for costs, and giving all credit to the final ad interaction. For example, a form submission may be an unqualified lead rather than a paying customer. Double-counted conversions can also distort results. Clear definitions of valuable actions, consistent attribution and sales records help prevent these errors from shaping budget decisions.
Good ROI is positive net profit relative to ad spend, with a return that supports the business’s goals. Around 200% is a broad reported benchmark for businesses, not a universal target. Profit margins, customer value and sales costs change what counts as a sustainable result. Compare performance with the business’s break-even point and lead or purchase quality, rather than judging success against one industry-wide figure.
ROI in paid advertising measures the net profit generated relative to the advertising investment. It helps a business assess whether a campaign contributes profit after relevant costs, rather than simply producing clicks or sales revenue. A useful calculation connects ad-attributed results with the expenses required to earn them. ROI is therefore a business outcome metric, while engagement measures describe activity along the customer journey.
A professional divides ad-attributed revenue by ad spend to calculate ROAS. To calculate ROI, they divide net profit by ad spend and multiply by 100. For example, the calculation should include costs that affect the profit from those sales, not just campaign spend. They also align the attribution period and reporting timeframe, so revenue and costs relate to comparable campaign activity.
Include ad spend and the costs of delivering the sales it generated. Depending on the business, these may include product or service costs, fulfilment, payment processing and allocated overhead. Management time may also matter when it represents a real resource used to run campaigns. Apply the same approach across reporting periods: leaving out a major cost can make an unprofitable campaign appear to generate a return.
A professional records meaningful outcomes, such as purchases or qualified leads, and connects them with the campaign activity that contributed to them. For offline sales, CRM records or offline conversion data can link a phone enquiry or in-person visit to an earlier ad interaction. Revenue values should reflect actual transactions, and duplicate or low-value actions should not inflate the results used for campaign decisions.


