Understanding Your Website Analytics Report: A 2026 Strategic Guide
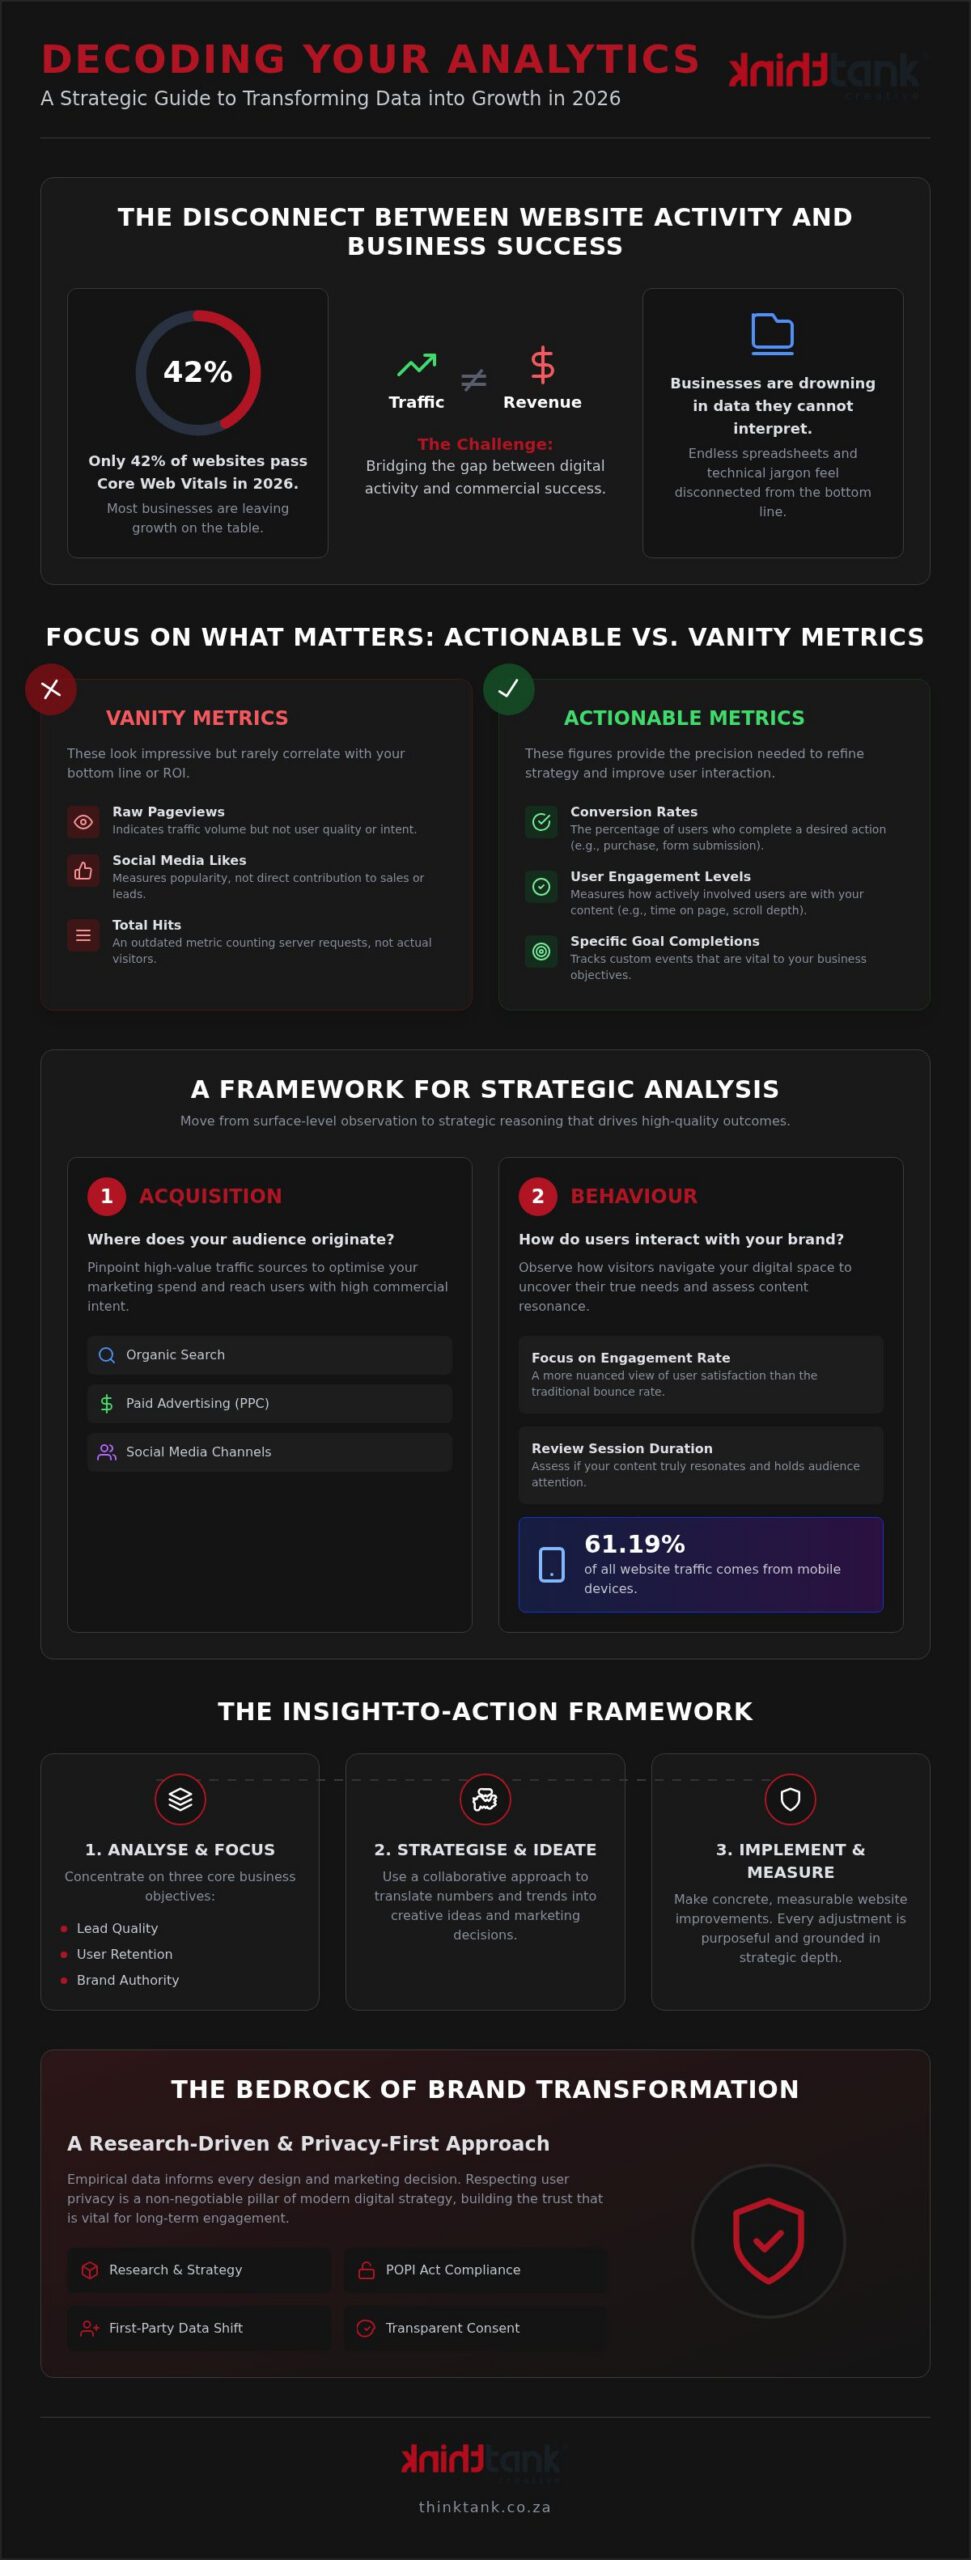
With only 42% of websites currently passing Core Web Vitals in 2026, most businesses are unknowingly leaving growth on the table whilst drowning in data they cannot interpret. You likely feel the weight of endless spreadsheets and technical jargon that feels disconnected from your actual bottom line. It's frustrating to watch traffic figures rise without seeing a corresponding lift in your revenue or engagement. Mastering the art of understanding your website analytics report is no longer a technical chore; it's a vital strategic advantage that bridges the gap between digital activity and commercial success.
Our guide ensures you can transform these complex data points into actionable insights that fuel your business growth. This resource provides a clear framework for identifying which metrics truly move the needle, allowing you to make confident investment decisions with quiet assurance. We'll examine the latest 2026 GA4 updates, including custom conversion windows and AI-powered trend analysis, to ensure your digital strategy is both precise and forward-looking. By the end of this article, you'll possess the clarity needed to turn confusing vanity metrics into a bespoke roadmap for elevation and excellence.
Key Takeaways
- Distinguish between deceptive vanity metrics and actionable data that reflects true commercial progress and revenue growth.
- Gain confidence in understanding your website analytics report to pinpoint high-value traffic sources and optimise your digital marketing spend.
- Decode the specific user behaviours that signal engagement and trust amongst your target audience to refine your creative strategy.
- Apply a structured insight-to-action framework to translate monthly reporting trends into concrete, measurable website improvements.
- Learn how a collaborative, research-driven approach to data serves as the essential bedrock for bespoke website design and long-term brand transformation.
Beyond Vanity Metrics: Why Interpreting Your Data is Non-Negotiable
Harness the power of raw data to fuel your creative evolution. At ThinkTank Creative, we view the Research & Strategy phase as the essential bedrock of our five-stage development process, where empirical data informs every design and marketing decision we make. A website analytics report is a strategic map for brand transformation. Without this clarity, your digital presence is guided by guesswork rather than the documented voice of your customer. True understanding your website analytics report begins by stripping away the noise of high-volume numbers that lack commercial substance.
We distinguish between two distinct categories of data to ensure your focus remains on growth:
- Vanity Metrics: These include raw pageviews, social media likes, and total hits. Whilst they may look impressive on a surface-level dashboard, they rarely correlate directly with your bottom line or ROI.
- Actionable Metrics: These involve conversion rates, user engagement levels, and specific goal completions. These figures provide the precision needed to refine your strategy and improve user interaction.
The Shift from Reporting to Interpretation
A static report is a conversation starter, not a final destination for an ambitious business owner. We believe in a collaborative approach where numbers are translated into creative ideas through constant communication. You can easily overcome data fatigue by ignoring the hundreds of available data points and focusing exclusively on three core business objectives: lead quality, user retention, and brand authority. This methodical focus ensures that every adjustment to your website is purposeful and grounded in strategic depth rather than a reaction to temporary fluctuations.
Data Privacy and the ZA Regulatory Landscape
Respecting the privacy of your South African audience is a non-negotiable pillar of modern digital strategy. As we move through 2026, nuances in POPI Act compliance and the global shift towards first-party data have changed how we track user behaviour. Utilising web analytics with a privacy-first mindset is no longer just a legal requirement; it's a powerful tool for brand reputation. By implementing transparent consent mechanisms and cookieless tracking where appropriate, you signal to your clients that your organisation values their digital rights. This ethical approach to data collection builds a foundation of trust that is vital for long-term user engagement and bespoke brand growth amongst a discerning local market.
Decoding the Core Metrics: A Framework for Strategic Analysis
Transform raw data into a blueprint for sustainable growth. Within the Planning stage of our five-stage development process, we use empirical data to define the scope of your brand’s digital evolution. Deepening your understanding your website analytics report allows you to move beyond surface-level observations and into the strategic reasoning that drives high-quality outcomes. This methodical approach ensures that every creative decision is grounded in evidence rather than assumption, setting the stage for a website that performs as beautifully as it looks.
Acquisition: Where Does Your Audience Originate?
Identifying the origin of your traffic is the first step in refining your digital marketing spend. You must distinguish between organic search, paid advertising (PPC), and social media channels to see where your most loyal customers reside. Effective keyword research for South Africa serves as the vital starting point for this acquisition data, ensuring you attract users with high commercial intent. By pinpointing high-value sources, you can allocate resources with the quiet assurance that your investment is reaching the right eyes amongst a crowded digital marketplace.
Behaviour: How Do Users Interact with Your Brand?
Observe how visitors navigate your digital space to uncover their true needs and frustrations. In 2026, the focus has shifted towards engagement rate, which offers a more nuanced view of user satisfaction than the traditional bounce rate. Reviewing common website analytics metrics like average session duration helps you assess whether your content resonates with your audience. With mobile devices accounting for 61.19% of all website traffic this year, your behaviour metrics must be segmented to ensure your mobile experience is flawless. If visitors leave quickly, it often highlights friction points in the user journey that require bespoke creative intervention. By mastering the art of understanding your website analytics report, you gain the ability to make meticulous adjustments that improve user retention whilst elevating your brand authority.
Conversion rate remains the ultimate metric for measuring the ROI of a website redesign. It bridges the gap between creative excellence and commercial success by tracking specific actions that lead to growth. Data confirms that technical performance is a catalyst for these results; for instance, a page that loads in one second can achieve an average conversion rate of almost 40%. When you see a tangible lift in leads or sales, you validate the strategic depth of your digital presence. If you're ready to elevate your brand, our team is here to help you optimise your website design for maximum impact and synergy.
Analysing User Behaviour: Understanding the 'Why' Behind the Clicks
Uncover the psychological drivers that transform a casual visitor into a loyal advocate. Whilst previous sections focused on the 'what', understanding your website analytics report requires a deep dive into the 'why'. In the South African market, trust is a currency earned through reliability and seamless interaction. Every click is a customer telling you what they value. By improving website user experience, you align your digital presence with these user expectations, creating an environment where engagement feels natural and effortless.
Technical health is the invisible foundation of positive user behaviour. If your platform is sluggish, your data becomes skewed by high drop-off rates before the user even sees your value proposition. Research shows that whilst the average mobile page load time is 8.6 seconds, those that load in just one second see significantly higher conversions. A slow site doesn't just lose sales; it provides a fragmented view of your audience's intent. Reviewing 10 important website analytics reports can help you identify where these technical barriers are preventing users from reaching your core content.
The Impact of Performance on Analytics
Mobile-first design is essential for capturing accurate data in the ZA market, where 61.19% of traffic originates from handheld devices. You must fix a slow loading WordPress site to ensure your analytics reflect genuine user interest rather than frustration-driven exits. When your site performs with precision, the behaviour flow in your report becomes a reliable narrative of the customer journey. This technical stability allows our team to move from mere maintenance into high-level strategic elevation, ensuring your data is a true reflection of your brand's potential.
Visualisation and Heatmaps
Visual data provides a sophisticated layer of insight that standard tables cannot match. Heatmaps allow you to see exactly where users linger and which calls to action they ignore. Our award-winning design team utilises this visual feedback during the 'Revision' and 'Fine-Tuning' phases of our development process to ensure every element is meticulously placed. By translating these heatmaps into better corporate identity and layout choices, we ensure your brand transformation is guided by evidence. This collaborative approach turns raw interaction data into a bespoke user experience that resonates with your specific audience, moving them smoothly from broad objectives to specific service areas.
The Insight-to-Action Framework: Making Data-Driven Decisions
Elevate your decision-making process by adopting a structured methodology that converts observations into measurable outcomes. Understanding your website analytics report is only half the battle; the true value lies in how you respond to the patterns revealed. We guide our partners through a methodical five-step cycle that ensures every adjustment is purposeful, strategic, and grounded in reality. This approach moves your brand from a reactive state to one of proactive growth, where documented data dictates the creative path forward and eliminates the risks of speculative changes.
Our framework begins with identifying a specific anomaly or trend within your monthly reporting. Once a pattern emerges, we formulate a hypothesis based on established user behaviour. During the 'Program' phase of our development process, our creative team is briefed to design a bespoke solution that addresses the root cause of the data shift. We then execute these changes, using A/B testing to validate the new strategy against real-world interactions. Finally, we review the subsequent report to measure success, ensuring a steady, reassuring cadence of improvement that mirrors the stability of your business.
Turning Negative Data into Positive Change
High bounce rates on critical landing pages often signal a disconnect between user intent and page content. Rather than viewing this as a setback, use it as a catalyst for refinement. If you notice organic traffic has stalled, it may be necessary to pivot your local link building strategies South Africa to better align with the evolving ZA search landscape. This collaborative journey involves discussing these findings openly with your agency partner to ensure your marketing and design efforts work in perfect synergy.
Budgeting Based on Real-World Performance
Allocate your digital marketing spend with the quiet assurance that comes from empirical evidence. By identifying the specific channels that consistently show the highest levels of user engagement, you can move away from fragmented, low-yield investments. Data-driven budgeting allows you to justify the investment in a site expansion or a bespoke new feature based on documented user requirements rather than gut feel. This meticulous approach to financial planning is the hallmark of a truly visionary organisation. The process of understanding your website analytics report ensures that every Rand spent is an investment in a proven path to success. If you're ready to make more informed investment decisions that drive genuine ROI, connect with our specialists to begin a collaborative review of your digital strategy.
Elevating Your Digital Strategy with ThinkTank Creative
Adopt a philosophy where your digital presence serves as a testament to your customer's intelligence. At ThinkTank Creative, we believe that whilst good marketing makes a company look smart, great marketing makes the customer look smart. This belief drives our five-stage development process, ensuring that every creative choice is a deliberate response to user needs. By understanding your website analytics report, we move beyond aesthetic appeal to create high-functioning digital environments that foster genuine brand transformation and growth.
Our role as an all-rounder agency means we don't just hand over a spreadsheet and leave you to decipher the implications. We are your approachable creative partner, founded in 2001, with the capacity to design, develop, and even provide printing solutions that align with your digital findings. This end-to-end capability ensures that the synergy between your online data and your physical brand remains unbroken. We do it all so you don't have to, providing a polished, invitation-based approach that emphasises mutual success over aggressive sales tactics.
A Partnership Built on Imagination and Evidence
Embark on a journey where imagination and evidence coexist in perfect harmony. Our award-winning design team uses your data as a compass, ensuring that the 'Planning' and 'Design' phases are rooted in the reality of your audience's behaviour. We prioritise usability and functionality, tailoring every bespoke website design to resolve the specific friction points identified in your reporting. This meticulous attention to detail transforms your site from a simple URL into a powerful business tool that reflects the craftsmanship of your organisation.
Next Steps for Your 2026 Strategy
Transition your online presence from a static site into a living digital asset that evolves alongside your market. Constant communication is the hallmark of our ongoing service, and we remain deeply invested in your journey long after the initial launch. We invite you to join us for a collaborative discussion to audit your current setup. During this session, we can explore how understanding your website analytics report can lead to improved conversion and user engagement. We provide an estimated cost for a comprehensive digital performance review after our initial discussion, ensuring our proposal is as bespoke as the solutions we create. Let's work together to elevate your brand to its highest potential through precision, synergy, and excellence.
Charting Your Path to Digital Excellence
Your digital presence is a living asset that requires constant refinement and strategic depth. By moving beyond the surface of vanity metrics and embracing a meticulous framework for interpretation, you empower your brand to make investment decisions with quiet assurance. Mastering the art of understanding your website analytics report ensures that every creative adjustment is a purposeful step towards higher engagement and measurable ROI.
As an all-rounder agency founded in 2001, ThinkTank Creative possesses the seasoned expertise to translate these complex numbers into bespoke design and marketing solutions. Our award-winning design team remains energised by the possibilities of the 2026 digital landscape, offering a collaborative partnership that prioritises your growth. We invite you to move from broad objectives to concrete success by aligning your technical health with the psychological needs of your audience.
Let’s embark on a journey of imagination together; contact ThinkTank Creative for a strategic audit. We look forward to helping you transform your data into a powerful narrative of brand elevation and excellence.
Frequently Asked Questions
What are the most important metrics to look at in a website analytics report?
Focus on actionable metrics like conversion rate, engagement rate, and lead quality rather than vanity metrics like raw hits. In 2026, tracking referral traffic from AI sources and monitoring Core Web Vitals are also essential for digital success. These specific numbers provide the foundation for our Research and Strategy phase, ensuring your digital presence aligns with actual business growth rather than superficial popularity.
How often should I be reviewing my website analytics?
Review your data at least once a month to identify long-term trends and anomalies effectively. Whilst daily checks can lead to over-analysis of minor fluctuations, a monthly cadence allows for strategic depth and methodical adjustments. This regular review forms part of our ongoing service, where constant communication ensures your digital strategy remains fluid and responsive to new possibilities in the competitive South African market.
Why is my bounce rate so high, and should I be worried?
A high bounce rate often indicates a disconnect between user intent and your landing page content or technical friction like slow load times. In 2026, GA4 focuses more on 'Engagement Rate', which offers a more nuanced view of user behaviour. If visitors leave within seconds, it's likely time to refine your UX design to ensure your brand transformation resonates with your target audience.
Can website analytics help me improve my offline printing and branding efforts?
Yes, analytics provide deep insights into which messaging and visual elements drive the most digital engagement. As an all-rounder agency, we use these digital findings to inform your corporate identity and printing solutions. If a specific campaign theme performs exceptionally well online, we can mirror that success in your physical marketing collateral, ensuring a consistent and elite brand experience across all channels.
What is the difference between a user and a session in my report?
A user represents a unique individual visiting your site, whilst a session encompasses the group of interactions that occur within a specific timeframe. Understanding this distinction is vital for understanding your website analytics report as it clarifies how often your favourite customers return. Segmenting these metrics helps us determine if your site serves as a dependable resource for recurring engagement or a one-time discovery point.
How do I know if my digital marketing spend is actually working?
Track your conversion rate and cost-per-acquisition across different traffic sources like PPC and organic search. By identifying which channels deliver high-value leads, you can allocate your budget with quiet assurance. We use these insights to justify the strategic reasoning behind your digital marketing spend, moving away from fragmented tactics towards a bespoke strategy that prioritises actual commercial success and long-term growth.
Is Google Analytics 4 (GA4) compliant with the South African POPI Act?
GA4 can be configured to meet POPI Act requirements by implementing robust consent mechanisms and anonymising IP addresses correctly. Being a privacy-first brand is essential for building trust amongst your South African audience in 2026. Our team ensures your data collection respects local regulatory nuances, providing a secure foundation for your analytics whilst maintaining the high-quality outcomes your business demands.
How can I see which specific pages are leading to the most enquiries?
Navigate to the 'Pages and Screens' report and filter by 'Key Events' to see which content drives the most conversions. This allows you to identify your most popular content and understand the psychology behind the clicks. Pinpointing these high-performing pages is a critical part of understanding your website analytics report, helping our award-winning designers fine-tune your layout for maximum engagement and synergy.