How to Measure Social Media Marketing ROI and Track Business Impact

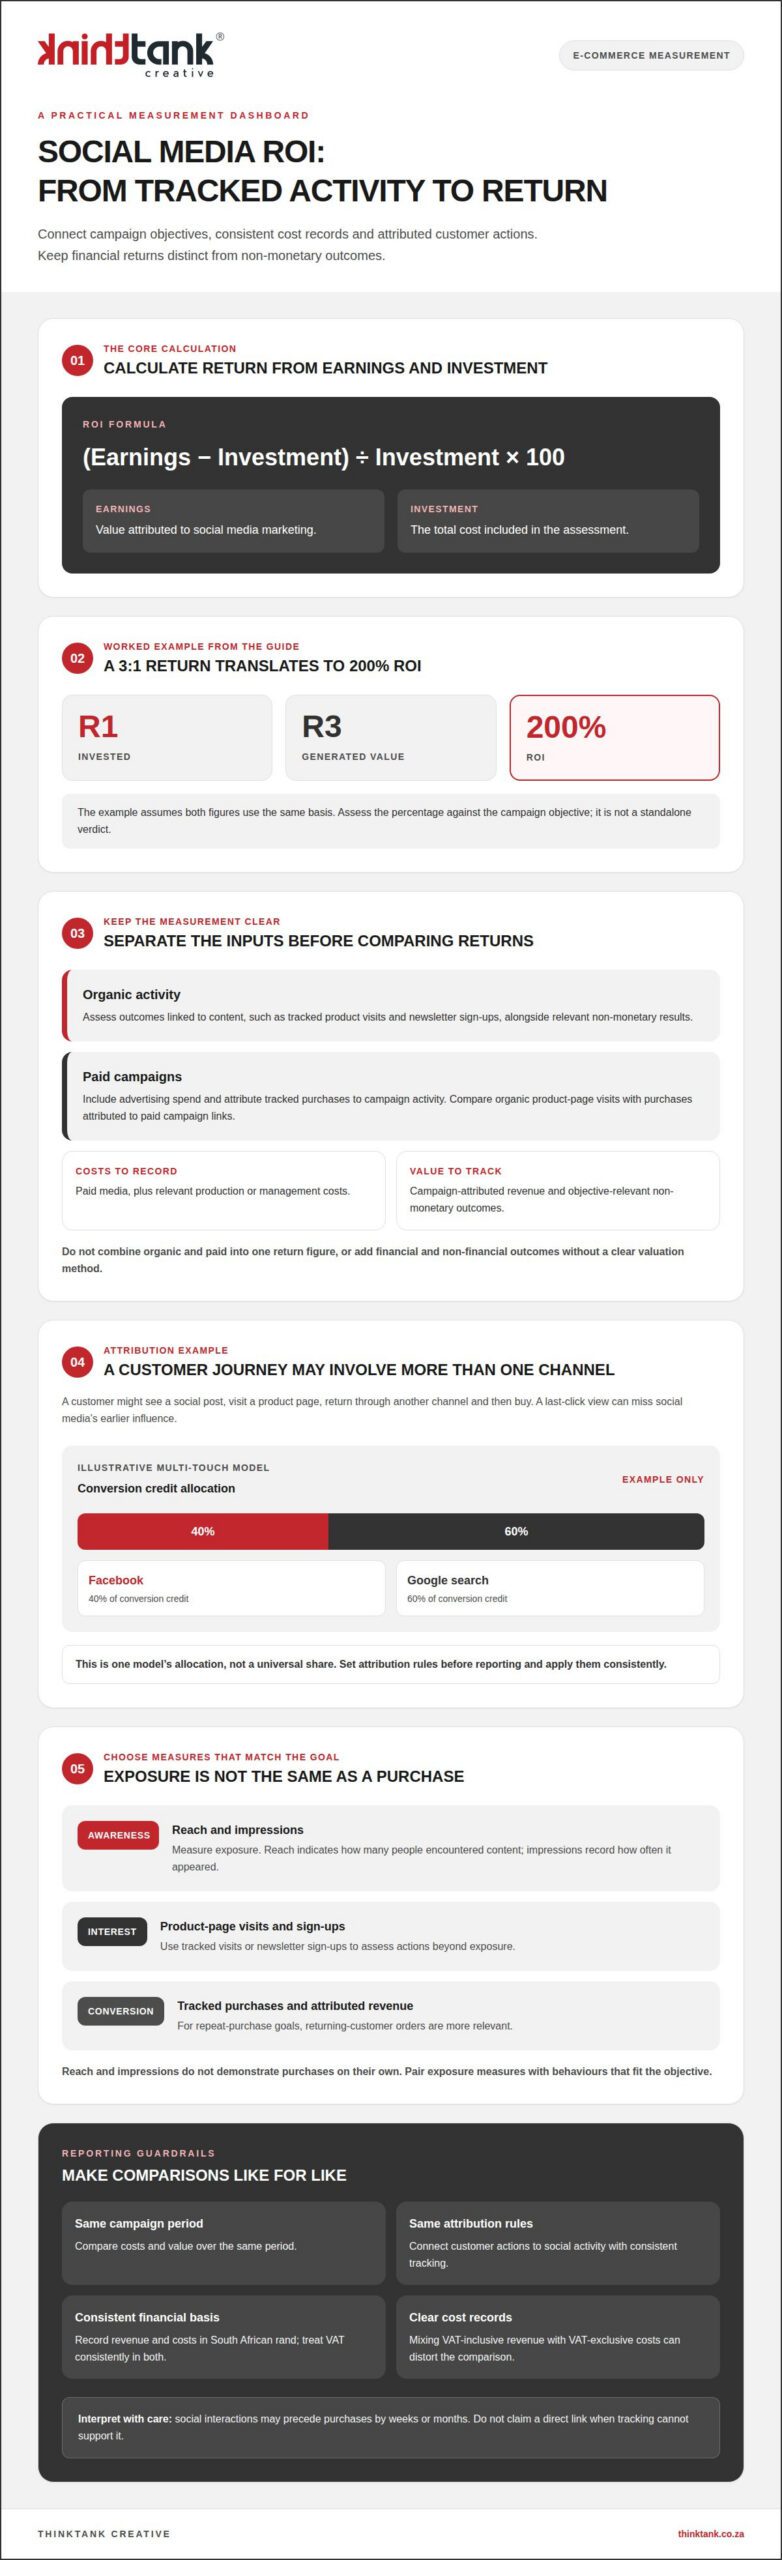
A campaign’s value isn’t measured by likes alone. Measuring social media marketing ROI means comparing the value generated with the total investment: subtract costs from earnings, divide the result by costs, then multiply by 100 to express the return as a percentage. For an e-commerce business, the calculation is only as useful as the objectives and sales attribution behind it.

It’s understandable to want a clear link between social activity and business results, especially when a sale may follow several interactions rather than a single click. A considered approach to measuring social media marketing ROI shows what social contributes, which parts of a strategy are working and where there’s room to improve.

This guide explains how to define social media ROI, choose awareness, engagement and conversion metrics, and assess returns for an e-commerce business. It also explores why measurement matters and how professional social media marketing can connect campaign activity with meaningful business outcomes.

Key Takeaways

  • Separate campaign costs from the value generated to build a more meaningful view of e-commerce returns.
  • Connect social interactions with purchase behaviour by considering the customer journey, not just the final click.
  • Choose awareness, engagement and conversion metrics that match the business objective you want to assess.
  • Set a clear definition of value before comparing campaigns, so financial and non-financial outcomes have context.
  • Use consistent measurement to identify what is working, refine strategy and make stronger decisions about investment.

How does a professional calculate social media ROI for an e-commerce business?

A sound measurement approach connects campaign objectives with costs, tracked customer actions and business value. Keep organic activity, paid media and financial reporting distinct to understand what each contributes.

  1. How a professional measures organic and paid social media ROI separately

    Separate organic and paid social media before assigning value. For organic activity, assess outcomes linked to content, such as tracked product visits or newsletter sign-ups, alongside relevant non-monetary results. For paid campaigns, include advertising spend and attribute tracked purchases to campaign activity. This distinction helps show whether results came from paid distribution or organic engagement. Avoid combining both into a single return figure, which can obscure how each approach contributes to the campaign objective.

    For example, compare organic product-page visits with purchases attributed to paid campaign links. Apply the same attribution method consistently to both.

  2. How a professional calculates campaign costs and revenue

    Keep a campaign cost record that captures the investment being assessed, including paid media and relevant production or management costs. Compare that total with campaign-attributed revenue, using tracking data that links social interactions to e-commerce purchases. A purchase is not automatically attributable just because it happened during a campaign: the tracking rules must connect the customer action with social activity.

    There is no single typical advertising cost or return for South African businesses. Costs depend on campaign objectives, paid spend and the scope of the work; returns depend on attributed revenue and which costs are included.

  3. How a professional compares social media costs with value

    Compare like with like: use the same campaign period and attribution rules for costs and value. Value may include revenue from tracked purchases or non-monetary outcomes, such as comments or newsletter sign-ups, when they support the stated objective. Keep these outcome types separate rather than adding them together without a clear valuation method.

    For financial reporting, record revenue and costs consistently in South African rand. Treat VAT consistently in both figures and keep the underlying financial records clear. Mixing VAT-inclusive revenue with VAT-exclusive costs can distort the comparison.

  4. How a professional calculates ROI from earnings and costs

    Apply the formula: (earnings minus investment) divided by investment, multiplied by 100. In this calculation, earnings are the value attributed to social media marketing, and investment is its total cost. For example, a 3:1 return means R3 in generated value for every R1 invested; if both figures use the same basis, the formula produces a 200% ROI.

    Use the result to assess the campaign against its objective, not as a standalone verdict. A percentage may look strong while overlooking non-monetary outcomes or an incomplete cost record.

Can a Professional Measure the ROI of Your Social Media Marketing?

Yes. A considered approach connects social activity with business objectives, tracked actions and purchase behaviour. Common mistakes include treating reach as revenue, relying only on last-click attribution and overlooking the influence of other channels.

  1. How a professional matches goals with ROI measures

    Start by translating each marketing objective into a metric that shows progress towards it. For a product launch, reach and product-page visits can indicate whether the campaign is attracting attention. For repeat purchases, returning-customer orders are more relevant. Avoid using the same metric for every objective: a large audience alone doesn’t show that a campaign generated sales.

    Record the objective, its matching metric and the assessment period in the measurement plan. This gives brands a consistent basis for interpreting results and keeps marketing strategy connected to business priorities. For awareness, assess exposure and subsequent interest; for sales, assess tracked purchases and attributed revenue.

  2. How a professional connects social metrics to purchases

    Map the customer journey from social interaction to purchase, using tracked visits and defined conversion events. A customer might see a post, visit a product page, return through another channel and then buy. A last-click view may award all the credit to that final channel, obscuring social media’s earlier influence.

    Set attribution rules before reporting, then apply them consistently across the campaign. Multi-touch attribution can distribute conversion credit across channels according to predefined rules or a statistical model. For example, one model assigns 40% of conversion credit to Facebook and 60% to Google search. The allocation describes that model, not a universal share for either channel.

    Allow for delayed influence when interpreting results. Social interactions can precede purchases by weeks or months, particularly for B2B and enterprise buyers. For e-commerce, compare the tracked journey with purchase records, and avoid claiming a direct link when tracking cannot support it.

  3. How a professional uses reach and impression measures

    Use reach and impressions to assess exposure, then connect that exposure with deeper actions. Reach indicates how many people encountered content; impressions record how often it appeared. Neither measure demonstrates purchases on its own, so pair it with relevant behaviours such as product-page visits, sign-ups or completed orders.

    Interpret each measure against the campaign objective and audience. An increase in impressions may reflect repeated exposure rather than more distinct people or stronger purchase intent. Compare it with engagement and subsequent actions to see whether content moved audiences towards the next step. Qualitative feedback, including positive comments, can add context to numerical metrics.

    Fragmented platform dashboards can make this assessment harder. Nielsen’s 2025 Marketing Report identifies bringing data together across separate platform dashboards as a top barrier to calculating ROI. A unified reporting view helps professionals interpret the campaign’s signals together. A coordinated social measurement approach can connect those signals with business objectives.

Awareness, engagement and conversion metrics

Useful KPIs depend on the objective: awareness uses reach and impressions, engagement tracks interactions, and conversion measures actions such as sign-ups or purchases. A professional groups these measures to show how social media efforts move audiences from exposure towards business outcomes.

  1. How a professional tracks awareness and engagement measures

    Choose awareness measures that describe exposure, then pair them with engagement measures that show audience response. Reach and impressions indicate whether content appeared before an audience; comments, shares, saves and clicks show how people interacted. A high impression count alone doesn’t establish brand awareness or commercial impact, so interpret it alongside meaningful engagement.

    Use campaign examples to give the figures context. Blendtec’s “Will It Blend?” videos had been viewed more than 100 million times on YouTube, illustrating substantial content exposure. That view count is an awareness signal, not proof of purchases. A professional assesses it alongside responses and subsequent actions, rather than treating views as a complete measure of return.

    For website activity, compare social-driven visits with relevant behaviour after arrival. Southwest Airlines’ redesigned blog recorded a 25% increase in visits and a 40% increase in page views. Those measures show changes in site activity; a separate conversion measure is needed to establish whether visitors took a valuable action.

  2. How a professional distinguishes micro and macro conversions

    Classify each conversion by its place in the customer journey. Ebook downloads, newsletter sign-ups and trial registrations are micro-conversions: they indicate interest before a final purchase. A completed product order is a macro-conversion for an e-commerce business. This distinction helps explain progress when a campaign generates engagement before sales appear.

    Where tracking allows, link each micro-conversion to a relevant later outcome. For example, assess whether newsletter sign-ups from social activity are followed by purchases, rather than automatically assigning them the same value. Keep the two event types separate in reporting, and don’t count one person’s sign-up and purchase as two completed sales.

    Micro-conversions can help assess campaigns whose immediate objective is consideration. They are useful indicators, but not substitutes for a purchase KPI when the objective is revenue. Report the sequence clearly, from social interaction to sign-up and, where tracked, purchase.

  3. How a professional selects conversion performance indicators

    Match conversion KPIs to the action the campaign is designed to generate. For an online shop, these may include tracked orders and revenue; for a lead-focused campaign, they may include qualified enquiries. Google Analytics can support analysis of website activity and defined events, while social platform reports provide channel-specific interaction measures.

    Set a consistent reporting window and event definition before comparing campaign performance. A click is not a purchase, and a landing-page visit is not necessarily a sign-up. Pair conversion volume with conversion value where available, then interpret both against campaign costs and the stated objective.

    Include qualitative feedback when it helps explain performance. Positive comments can add context to engagement figures, while completed orders show a direct commercial outcome. Reporting both gives decision-makers a clearer view of what social media activity achieved.
How to Measure Social Media Marketing ROI and Track Business Impact

Defining social media ROI

Define social media marketing ROI before measuring it. The business objective determines which outcomes count as value, from sales to newsletter sign-ups.

  1. How a professional sets social media goals

    Translate a business priority into a specific social media goal. For example, a retailer launching a product could target product-page visits, while a brand focused on repeat purchases could track returning-customer orders. The goal should describe a business outcome, not simply activity such as publishing posts or gaining followers.

    Next, match the goal to an observable measure and decide how the result will be attributed. For a Facebook campaign, track visits from campaign links and subsequent purchases. Don’t choose metrics just because a platform makes them easy to report: each measure should help assess the intended outcome.

    Set the scope before evaluating results. Specify which campaign, platforms and audience the assessment covers, and keep those boundaries consistent when comparing performance. If a campaign supports both awareness and sales, record them as distinct objectives so engagement doesn’t become a substitute for purchase results.

  2. Define the return being measured

    Social media ROI is the value generated by social media investment, assessed against the chosen objective. Value may be financial, such as attributed e-commerce revenue, or non-financial, such as comments and newsletter sign-ups. Both outcomes can matter, but they shouldn’t be combined as if they were equivalent measures.

    For a sales objective, focus on purchases and revenue attributed to social activity. For an awareness objective, relevant indicators might include audience response or new newsletter sign-ups. Define what counts as value before reporting, so measuring social media marketing ROI reflects the goal rather than whichever metric looks most impressive.

    Then document the attribution approach. A customer may encounter a social post, visit a product page later and complete a purchase after another interaction. The chosen rules determine how much credit social receives. Applying the same approach across campaigns makes comparisons more meaningful, while recognising that a single platform interaction may not capture the whole customer journey.

    Finally, separate return from performance activity. Facebook likes, comments and clicks describe interactions; they don’t automatically demonstrate financial return. If the objective is community engagement, comments may represent relevant value. If it is sales, connect platform activity to tracked purchases before presenting it as revenue generated.

Reasons to measure social media ROI

Measurement turns social activity into evidence for decisions about strategy, investment and customer relationships. Its value goes beyond showing whether a campaign generated sales.

  1. Use performance evidence to explain social media’s contribution to business outcomes. Sixty-eight per cent of marketers report worrying about proving the return on their social media efforts, while 46% believe social media use improves sales. Tracking results against a stated objective helps distinguish evidence of progress from assumptions about impact.

    For example, an e-commerce team can connect social activity with product interest and tracked orders. If orders rise but social-attributed visits do not, examine the attribution approach before claiming social caused the increase.

  2. Compare results over time to identify which content supports growth. Tracking progress across six months, for example, can show whether product demonstrations or customer stories generate stronger responses. A consistent comparison period helps teams interpret changes without treating one successful post as proof of a lasting trend.

    Pair the figures with platform context. Google Analytics can help assess website activity alongside platform engagement, while positive comments may explain why a particular message resonated. Neither comments nor visits alone prove revenue, but together they can inform the next campaign decision.

  3. Connect social insights with decisions beyond the marketing team. Among marketers who work with social data, 98% agree that social insights have enabled cross-functional business outcomes. Social feedback can help teams consider customer experience, retention and messaging, rather than limiting reporting to likes or reach.

    For instance, repeated questions in comments about product sizing could help a retailer identify an issue with content or product information. Sharing that pattern with the relevant team gives the feedback a practical purpose, while keeping it distinct from measured sales outcomes.

  4. Use audience signals to inform retention and market decisions. Among marketers reporting business outcomes from social intelligence, 45% cite customer retention as a benefit, and 40% cite identifying a new audience or market shift. These findings show why social analysis can contribute to decisions beyond campaign reporting.

    A rise in positive comments from a previously overlooked audience, for example, may prompt a brand to examine that audience’s needs. Comments are a signal to investigate, not proof of demand or a substitute for purchase data.

  5. Make budget discussions more evidence-led by showing what social activity supports. Kellogg found that Special K cereal’s online return on investment was twice the return from television over 18 months. The comparison illustrates how channel-level evaluation can inform investment choices, while each business still needs measures suited to its own objectives.

    Use findings to refine the next campaign, not simply to defend past spending. Strengthen your social media measurement approach by connecting campaign results with the business decisions they can inform.

ThinkTank Creative: Social Media Marketing

ThinkTank Creative provides Social Media Marketing to help businesses shape campaigns around clear objectives and meaningful outcomes. Turn to this support when social activity needs a more considered strategy, or when reporting needs to connect engagement with business impact.

Effective measurement depends on more than platform figures. It requires a coherent approach to objectives, audience response and the actions that matter to the business. Where digital touchpoints need closer alignment, Website Design and Development and Creative design can support a consistent experience from social content to the website.

Bring your business goals and current measurement challenges into the conversation. Contact ThinkTank Creative to discuss your social media marketing needs.

Turn your social data into your next decision

Make each reporting cycle a starting point for a sharper business decision. A disciplined approach to measuring social media marketing ROI can help your team decide which audience to prioritise, what creative direction to develop and how social activity should support the wider customer experience. The next opportunity may not be another campaign; it could be improving how people move from discovering your brand to engaging with it.

That work benefits from alignment between strategy, creative and the digital destination. ThinkTank Creative offers Social Media Marketing, Creative design and Website Design and Development, bringing relevant disciplines together around your business objectives. Use each measurement cycle to refine the connection between what your audience sees and the action you want them to take.

Ready to shape a more considered approach for your business? Contact ThinkTank Creative to discuss your goals and take the next step with confidence.

Frequently Asked Questions

How do data silos across platforms affect ROI tracking?

Data silos make it harder to connect platform activity with website behaviour and completed orders. For example, Facebook may record an advert click while website analytics records a later purchase under another source. Align campaign names, tracking labels and conversion definitions across reports, then investigate mismatches. This helps reduce inconsistent attribution and prevent the same purchase from being counted more than once.

How do delayed conversions and long sales cycles affect ROI measurement?

Delayed conversions can make a campaign appear ineffective if reporting ends before customers purchase. Social media influence may precede a decision by weeks or months, particularly in B2B and enterprise sales. A professional follows campaign cohorts over a reporting window suited to the sales journey, separating early indicators from completed revenue. This gives later conversions room to appear without treating every subsequent sale as social-driven.

How does a professional calculate ROI for brand awareness campaigns?

To calculate awareness ROI, assign a defensible value to the awareness outcome, then compare it with campaign investment. For example, a business might assess a defined increase in relevant audience attention against its campaign objective. Any monetary valuation should use a consistent method and be labelled as estimated value, not sales revenue. Without a credible valuation, report awareness outcomes separately rather than implying financial ROI.

How does a professional quantify non-monetary value?

First define which non-monetary outcomes matter, such as positive comments, newsletter sign-ups or qualified interactions. Count each outcome using a consistent event definition, then assess it against the campaign objective. If a business assigns a financial equivalent, it needs a clear rationale, such as a known relationship between sign-ups and later purchases. Otherwise, keep the outcome as a separate performance measure.

What is multi-touch attribution across channels?

Multi-touch attribution distributes conversion credit across the channels a customer interacted with before purchasing. A customer might discover a product through a social post, return through an email and complete an order after a search. Apply predefined rules or a statistical model to allocate credit across those interactions. The chosen model shapes the reported contribution, so comparisons require consistent attribution rules.

What metrics should you track for awareness and reach?

Track reach to understand how many people saw content, and impressions to assess total exposure. Audience growth, video views and relevant profile visits can add context, depending on the campaign format. Compare these measures with the intended audience and content type: high exposure alone doesn’t demonstrate recognition or purchase intent. Comments and shares can also help explain how people respond to the message.

What metrics should you track for conversion and revenue?

For an e-commerce campaign, track completed purchases and revenue attributed to social activity. Conversion rate shows how often relevant visits lead to the chosen action, while average order value adds context to revenue. Cost per acquisition can help compare spending with acquired customers. Define whether cancelled or refunded orders are included, then apply that treatment consistently across campaign reports.

How does a professional calculate social media marketing ROI?

A professional subtracts social media investment from the value attributed to social activity, divides the result by that investment and multiplies by 100. The result is a percentage. For example, a return above zero indicates attributed value exceeded the included investment; a result below zero indicates the opposite. The calculation is only meaningful when earnings and costs cover the same campaign scope and reporting period.
Measuring Google Ads ROI through costs, revenue and net profit

A healthy-looking Google Ads return can still hide an unprofitable campaign. Measuring Google Ads ROI means looking beyond revenue and ROAS to account for the costs that determine net profit. New campaigns need time to gather conversion data: allow 2-4 weeks for initial learning and 60-90 days of optimisation to assess whether performance is stabilising and producing reliable ROI data.

It’s understandable to want a clear answer quickly, especially when every click uses part of your marketing budget. But conversion tracking, lead quality, sales outcomes and business costs all affect the result. Revenue alone cannot show whether advertising is contributing to profit.

This article explains how to track conversions, calculate ROI and distinguish it from ROAS. It also explores how results vary by business type, when campaigns may show meaningful performance, and how the data can guide focused improvements.

Key Takeaways

  • Set conversion tracking around meaningful outcomes, then connect lead activity with the sales or revenue it generates.
  • Use ROAS to understand revenue relative to ad spend, and ROI to see whether the campaign remains profitable after relevant costs.
  • Include product, fulfilment and management costs in your calculations to build a more realistic view of net profit.
  • Segment performance by campaign and audience to find where budget changes or creative tests could make the greatest difference.
  • Judge results against your business model, margins and customer value rather than relying on a single benchmark for every industry.

Conversion tracking

Reliable ROI measurement starts by recording the actions that matter to a South African business. Google Ads conversion tracking connects ad interactions with those outcomes, giving performance analysis a stronger foundation than click totals alone.

Tracking conversions and micro-conversions

Conversion tracking records valuable actions after an ad interaction, while micro-conversions capture meaningful steps towards those outcomes. Choose actions that match the business goal, such as a completed purchase, qualified enquiry, phone call or appointment booking. For an auto repair shop, calls from an ad, calls after an ad click, contact form submissions and completed booking forms can all count as conversions.

Google Ads provides a free conversion tracking tool to measure how many clicks lead to conversions. You can also connect Google Ads with Google Analytics to understand campaign activity across channels. This helps distinguish a completed sale from an early signal, such as a form start, so minor interactions don’t inflate the value assigned to advertising.

Conversion rate is total conversions divided by total clicks, multiplied by 100. Cost per acquisition (CPA) is total ad spend divided by total conversions; cost per lead uses total advertising spend divided by the number of leads. These measures answer different questions: conversion rate shows how often clicks lead to action, whilst CPA shows the spend associated with each recorded outcome.

For South African reporting, keep revenue, advertising spend, conversion values and VAT treatment consistent. If sales or costs are in another currency, record the exchange rate used to convert them into Rand rather than mixing currencies in one calculation. Use actual local transaction values for conversions, not assumed values that obscure what the business earned.

Conversion benchmarks also depend on the service and the action being measured. Legal and healthcare industries often have search conversion rates above 6%, but that figure isn’t a universal target for South African service businesses. A professional compares like-for-like actions and considers whether enquiries become qualified leads, appointments or paying customers.

Attribution and conversion profitability

Attribution assigns credit to advertising interactions that contribute to a conversion, while profitability analysis checks whether the resulting value exceeds its costs. A Google Ads attribution window may be 30 or 90 days; conversions outside the chosen window aren’t counted. Professionals consider multi-touch attribution when several advertising touchpoints influence a customer journey.

For revenue measurement, set up conversion tracking for a purchase or revenue event. When a sale happens offline, such as after a phone enquiry or in-person visit, offline conversion tracking can connect the outcome to the earlier ad interaction. A CRM can link campaign activity with revenue, lead quality and customer lifetime value. Together, these records make cost per conversion more useful: the key question is not just how many actions occurred, but whether they produced profitable business.

What Is the Difference Between Google Ads ROAS and ROI?

ROAS compares ad-attributed revenue with advertising spend, while ROI measures profit against investment. To compare Google Ads with other marketing channels, assess each using consistent attribution, time periods and cost calculations.

ROAS and profit-based ROI

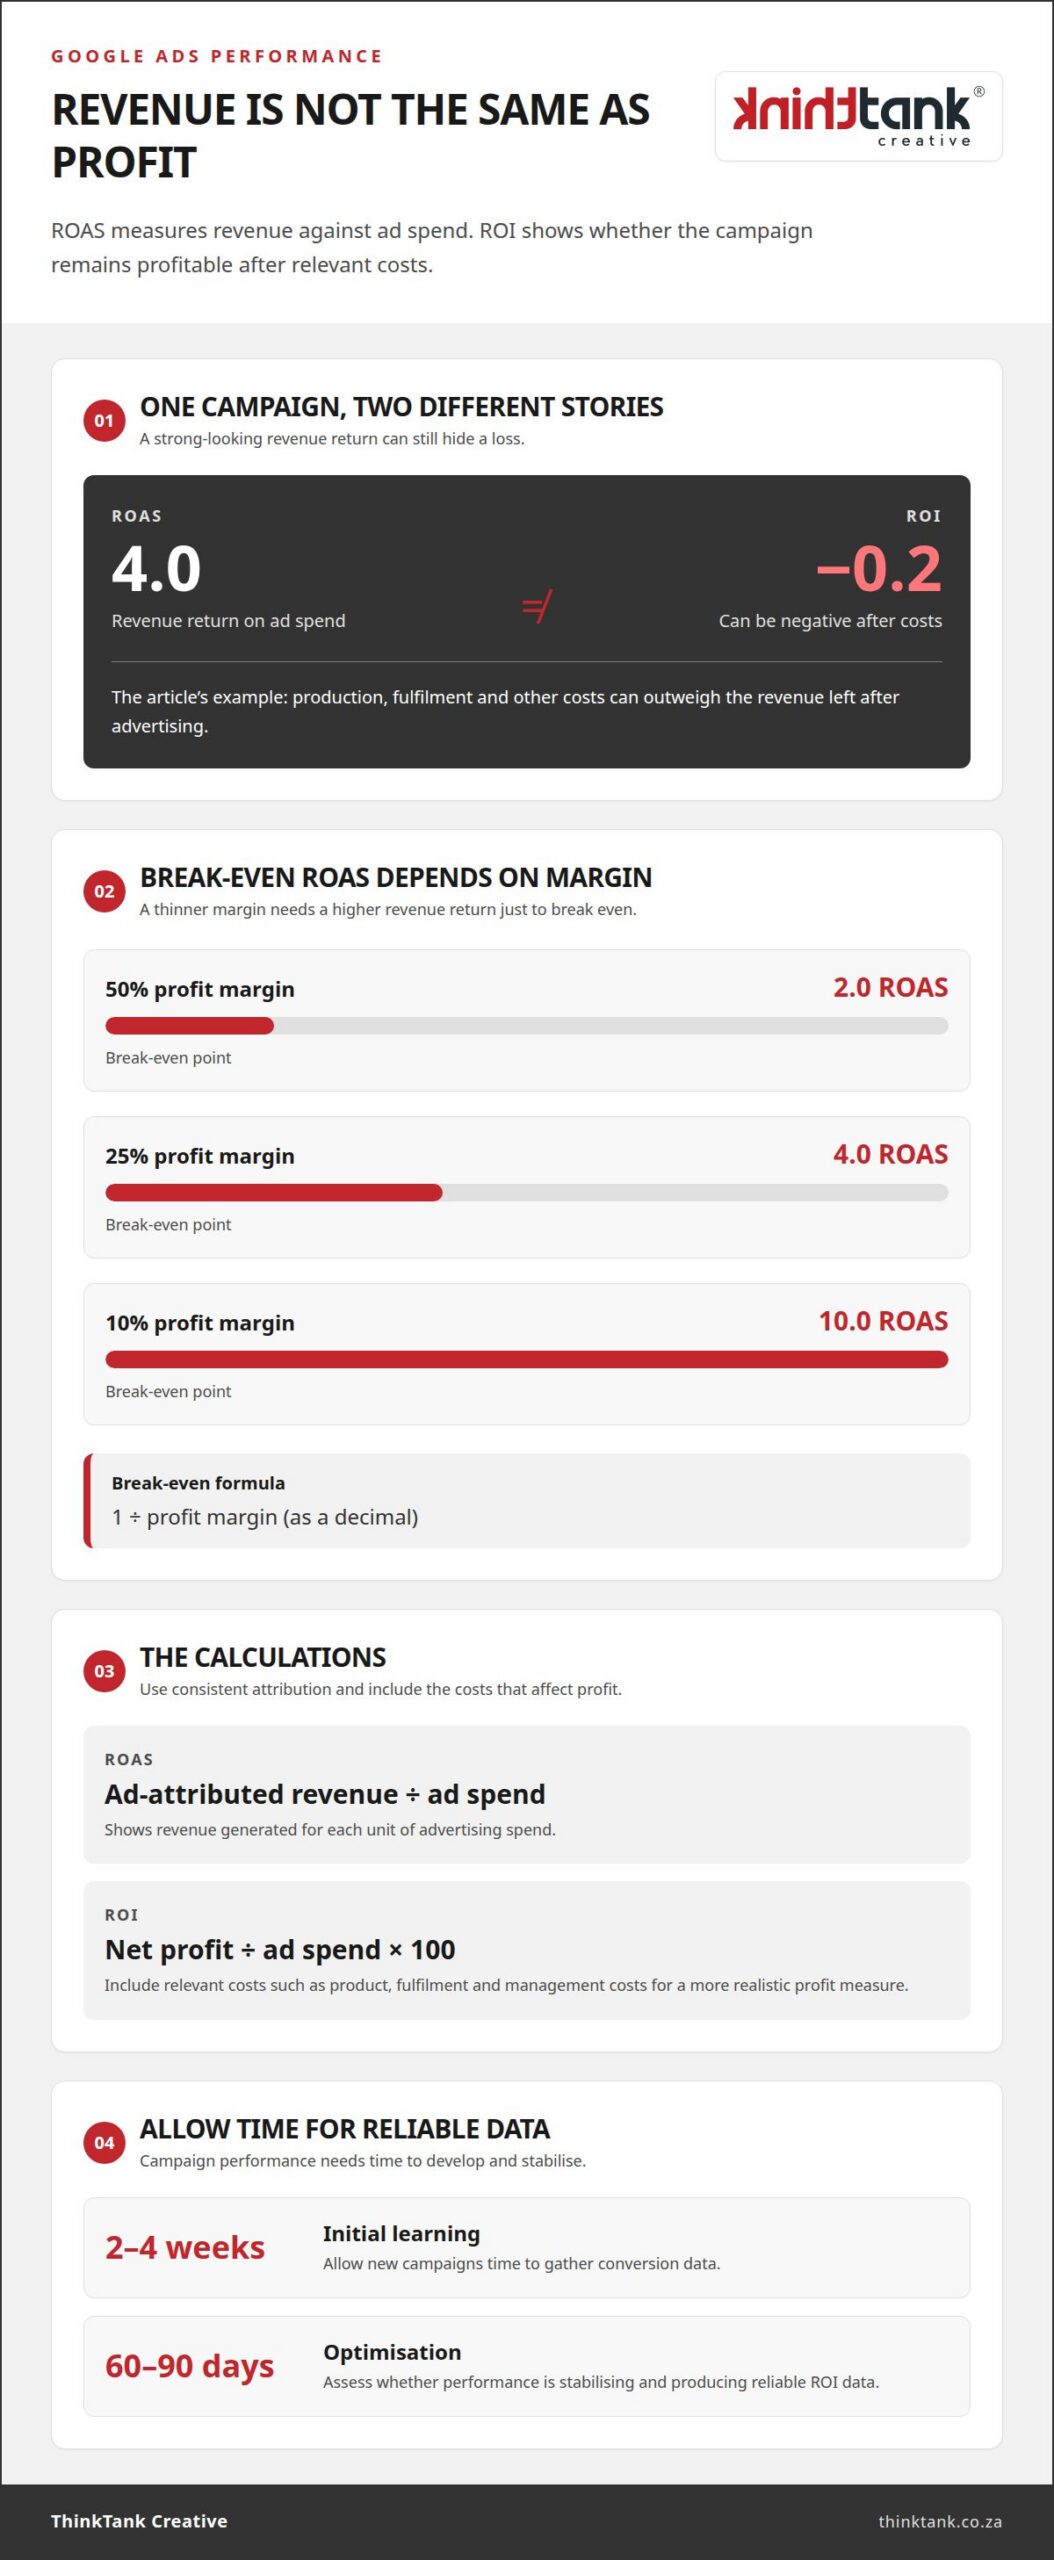
ROAS shows how much revenue advertising generates for each unit of ad spend. Profit-based ROI asks whether the campaign earns more than its attributable costs. A 4.0 ROAS can still produce a -0.2 ROI when production, fulfilment and other costs outweigh the revenue left after advertising.

These metrics answer different business questions. ROAS helps compare revenue efficiency between campaigns, while ROI indicates whether the investment creates profit. Clicks and attributed sales describe activity, but they don’t show the full return unless you also account for costs and profit margins.

Break-even returns and profit margins

Break-even ROAS is the revenue-to-ad-spend ratio needed to cover advertising costs at a given profit margin. Calculate it by dividing 1 by the profit margin expressed as a decimal. At a 50% margin, a 2.0 ROAS breaks even; at a 25% margin, break-even rises to 4.0.

A 10% margin requires a 10.0 ROAS to break even. The same revenue return can therefore mean profit for one business and a loss for another. Use the margin on the revenue driven by ads, rather than treating a general ROAS benchmark as a profit target.

Calculating ROAS and ROI

For ROAS, divide revenue attributed to ads by ad spend. For ROI, divide net profit by ad spend, then multiply by 100. A professional includes relevant costs when calculating net profit, so the result reflects more than the sales value recorded against campaign clicks.

Related metrics add context. CPA is the cost of acquiring a customer or lead; AOV means average order value. LTV estimates customer value over their relationship with a business, using average purchase value, purchase frequency and customer lifespan. A higher CPA may be viable when LTV supports it.

Compare channel returns on equivalent terms: use consistent attribution rules, conversion values and cost coverage for Google Ads, social media and email. A channel’s reported revenue can reflect different customer journeys, so assess the profit it contributes, not just its attributed sales. For a more joined-up view, consider campaign performance analysis.

Optimising campaigns using performance data

Campaign optimisation works best when you compare meaningful results over time, not isolated clicks. In South Africa, that means balancing growth opportunities with cash flow and the campaign’s actual goals.

Baselines and industry benchmarks

A baseline is a campaign’s starting performance, assessed against its previous 3-6 months of data where available. It gives professionals context for changes in conversions, costs and revenue, rather than judging an adjustment against a single day. Industry benchmarks add perspective, but they can’t replace a business-specific comparison.

For example, retail search conversion rates average around 2.8%. That figure is a reference point, not a target for every South African online shop. A professional compares similar products, customer journeys and conversion actions, then considers whether the landing page reflects the ad’s promise and supports purchases.

Analytics can show where performance changes: by campaign, device, location, time of day or creative. You can adjust bids towards stronger segments, exclude irrelevant searches with negative keywords, and align each landing page with search intent. These changes connect observed behaviour with practical optimisation decisions.

Learning and stabilisation periods

A learning period gives a new campaign time to gather conversion data before performance is judged. Allow at least 2-4 weeks for that data to accumulate, then assess whether changes are improving outcomes. Reliable ROI often needs a longer view: campaigns may take 60-90 days to stabilise and produce dependable results.

This timeline matters for cash flow. A business should account for advertising spend during the learning period, while avoiding abrupt budget changes that make results harder to interpret. Once a campaign has meaningful data, professionals can adjust budgets gradually, such as increasing spend by 10-20% every few days whilst monitoring performance.

Performance against campaign goals

Compare campaign results with the agreed business goal, such as qualified enquiries, purchases or revenue. Consider both volume and value: a campaign producing more leads may still underperform if few progress to sales. CRM outcomes can help connect campaign activity with lead quality and revenue.

Goals also guide which optimisation matters. For online commerce, the focus may be purchase value and profitable growth; for lead generation, it may be qualified enquiries and their eventual contribution to sales. Segment performance by campaign and creative so budget decisions reflect which activity supports the intended outcome.

When a campaign falls short, investigate the evidence before changing direction. You might test ad copy or landing-page variations, review device and location performance, or refine targeting. A controlled test isolates the change, making it easier to tell whether it improved conversions or simply shifted clicks.

Use each review to make a clear decision: retain what meets the goal, refine weak points and keep testing where evidence is limited. This measured approach helps protect cash flow while making room for sustainable growth.

Measuring Google Ads ROI through costs, revenue and net profit

Calculating revenue, costs, net profit, and ROI

For lead-generation campaigns, connect Google Ads spend with qualified enquiries, sales and revenue. Measuring Google Ads ROI means assessing the profit those results contribute after relevant costs, not treating every recorded lead as a completed sale.

Revenue, costs and net profit

Revenue is the Rand value of sales attributed to advertising; net profit is what remains after relevant costs are subtracted. This distinction shows whether campaign-generated business contributes profit after delivery and operating expenses.

A professional connects campaign records with sales data, then accounts for costs such as goods or service delivery, fulfilment and allocated overhead. Payment processing fees may also affect the result; one calculation approach uses a 2-3% allowance of revenue. Consistent cost categories make comparisons across campaigns more meaningful, because each result reflects a similar view of what it took to generate sales.

Lead-generation revenue requires a link between enquiries and completed sales. If one sale results from every 10 leads, professionals use actual sales records and the value of those sales to assess the revenue associated with the leads. CRM data can distinguish qualified prospects from enquiries that do not progress, giving the ROI calculation a clearer commercial basis.

ROI calculations and examples

Calculate ROI by dividing net profit by ad spend, then multiplying by 100. Net profit must account for the advertising cost and other relevant expenses, so the result reflects profit against campaign investment.

For example, a 200% ROI means the net profit equals twice the ad spend under this formula. When measuring Google Ads ROI, a professional examines the underlying sales and cost records before interpreting that percentage. If fulfilment or overhead is omitted, the calculation can overstate the campaign’s contribution.

Keep the reporting period consistent by matching campaign spend with the related revenue and costs. A sale may follow an enquiry later, so use attribution and sales records to connect the transaction with the advertising that contributed to it. This gives you a more useful ROI assessment than clicks or enquiries alone.

Cost per lead and lead-generation returns

Cost per lead is total advertising spend divided by the number of leads. It shows the average campaign spend per enquiry, but does not establish whether those leads become profitable customers.

To assess lead returns, a professional follows the path from ad interaction to enquiry, qualified opportunity and sale. If 10 leads produce one sale, the business’s actual sale value and related costs help determine the profit generated. Measuring Google Ads ROI for lead generation therefore depends on connecting lead quality with later sales outcomes, rather than assigning equal value to every enquiry.

These insights can also guide targeting decisions. A campaign with a lower cost per lead may deliver weaker returns if its enquiries rarely convert, while higher-cost leads may produce stronger sales. Professionals compare lead quality, sales outcomes and spend before adjusting targeting or budgets.

Typical Google Ads ROI by business type

There’s no single return that defines success for every business. A useful benchmark depends on profit margins, customer value, sales cycles and the conversion the campaign is designed to generate.

For direct-to-consumer businesses, a ROAS guideline is 3.0x to 5.0x. This range can help frame campaign performance, but it doesn’t establish profitability by itself. Product costs, delivery expenses and other operating costs affect how much revenue remains as profit. A South African retailer should assess its own margins before treating a return in this range as a success.

E-commerce guidance also gives a 2.75x ROAS benchmark. That figure differs from the direct-to-consumer range because benchmarks can use different assumptions and business models. Rather than combine them into one target, a professional identifies the closest comparison, then considers the store’s average order value, repeat purchases and costs.

Business-to-business campaigns have a wider ROAS guideline, from 4.0x to 10.0x, depending on sales cycle and conversion value. A longer sales process can mean that a click or enquiry takes time to generate revenue. Campaign analysis should connect the keyword and audience to qualified opportunities, then follow those opportunities through to sales.

Service businesses also need to judge lead quality, not just enquiry volume. Optimised campaigns for service businesses can exceed 200% ROI when focused on lead quality. That isn’t a universal result: the return depends on how many leads become customers, the value of each sale and the costs involved. A strategy that captures more suitable enquiries may contribute more than one generating a larger number of unqualified leads.

Results can vary widely across digital product campaigns and businesses, so benchmarks should be treated as context rather than a promise. These figures offer context, not a promise or a target for every South African advertiser. Differences in margins, sales journeys and customer value make direct comparisons unreliable unless the calculations use comparable costs and attribution.

Use benchmarks to ask better questions: does this campaign attract the right audience, generate valuable conversions and support profitable growth? A professional can compare results with the business’s margins and goals, then optimise targeting, keywords and campaign strategy accordingly. For support refining your Google Ads campaign strategy, connect your performance goals with a focused PPC approach.

ThinkTank Creative

ThinkTank Creative helps businesses connect campaign goals with the digital experiences customers encounter along the way. If ad clicks lead to a website that doesn’t clearly guide visitors towards an enquiry or purchase, Website Design and Development can strengthen that journey. Social Media Marketing and creative design can also support consistent communication across customer touchpoints.

Consider this support when performance data points to gaps between attracting an audience and helping people take action. A clear website experience and cohesive messaging give your campaigns a stronger foundation for turning relevant visits into meaningful outcomes.

Contact ThinkTank Creative to discuss how your digital experience can better support your marketing goals.

Build your next growth decision on evidence

Make campaign measurement part of a wider growth conversation, not just a reporting exercise. A disciplined approach to measuring Google Ads ROI can help your team decide where to focus, which parts of the customer experience need attention, and how advertising supports your business priorities.

ThinkTank Creative can help shape that wider digital experience through Website Design and Development, Social Media Marketing and creative design. These capabilities support a consistent journey from the first interaction to the point where a potential customer takes action. Discuss how your campaign objectives and customer experience can work together.

Discuss your campaigns with ThinkTank Creative and explore a considered path towards your marketing goals.

Frequently Asked Questions

How quickly should Google Ads show positive ROI?

Allow time for reliable conversion data before judging a campaign’s return. New campaigns may need 2-4 weeks to gather data, while 60-90 days can provide a better view of stabilising performance. The timeline depends on how quickly clicks turn into trackable sales or qualified leads. A long sales cycle can delay visible revenue, so early results may not reflect the campaign’s eventual contribution.

Is negative immediate ROI acceptable if lifetime value is high?

It can be acceptable if later customer value is supported by actual purchase and retention data. For example, a 1:1 ROAS may be acceptable when a customer is expected to generate four times as much revenue over time. However, future revenue isn’t the same as profit: consider the cost of serving repeat purchases and the time required to earn them before treating an initial loss as sustainable.

What are the Common Mistakes When Measuring Advertising ROI?

Common mistakes include counting every enquiry as a sale, relying on revenue without accounting for costs, and giving all credit to the final ad interaction. For example, a form submission may be an unqualified lead rather than a paying customer. Double-counted conversions can also distort results. Clear definitions of valuable actions, consistent attribution and sales records help prevent these errors from shaping budget decisions.

What constitutes good ROI for Google Ads?

Good ROI is positive net profit relative to ad spend, with a return that supports the business’s goals. Around 200% is a broad reported benchmark for businesses, not a universal target. Profit margins, customer value and sales costs change what counts as a sustainable result. Compare performance with the business’s break-even point and lead or purchase quality, rather than judging success against one industry-wide figure.

What is ROI in Paid Advertising?

ROI in paid advertising measures the net profit generated relative to the advertising investment. It helps a business assess whether a campaign contributes profit after relevant costs, rather than simply producing clicks or sales revenue. A useful calculation connects ad-attributed results with the expenses required to earn them. ROI is therefore a business outcome metric, while engagement measures describe activity along the customer journey.

How does a professional calculate Google Ads ROI and ROAS?

A professional divides ad-attributed revenue by ad spend to calculate ROAS. To calculate ROI, they divide net profit by ad spend and multiply by 100. For example, the calculation should include costs that affect the profit from those sales, not just campaign spend. They also align the attribution period and reporting timeframe, so revenue and costs relate to comparable campaign activity.

Which costs should be included when measuring Google Ads ROI?

Include ad spend and the costs of delivering the sales it generated. Depending on the business, these may include product or service costs, fulfilment, payment processing and allocated overhead. Management time may also matter when it represents a real resource used to run campaigns. Apply the same approach across reporting periods: leaving out a major cost can make an unprofitable campaign appear to generate a return.

How does a professional track conversions and revenue accurately in Google Ads?

A professional records meaningful outcomes, such as purchases or qualified leads, and connects them with the campaign activity that contributed to them. For offline sales, CRM records or offline conversion data can link a phone enquiry or in-person visit to an earlier ad interaction. Revenue values should reflect actual transactions, and duplicate or low-value actions should not inflate the results used for campaign decisions.

Measuring the ROI of a Website Redesign: Strategic 2026 Framework

Treating an enterprise digital overhaul as a mere cosmetic face-lift is the quickest way to squander capital. When internal stakeholders view web development as an operational overhead rather than a hardworking commercial asset, measuring the roi of a website redesign becomes an exhausting uphill battle. It's entirely reasonable to dread post-migration search visibility dips, or to feel frustrated whilst trying to link modern user experience design directly to closed pipeline revenue.

True commercial returns stem from conversion velocity and technical efficiency, never surface-level decoration alone. In this strategic guide, you'll discover how to quantify tangible financial gains, operational savings, and measurable conversion growth across both immediate and multi-year horizons. We'll walk through the definitive ROI formula, critical Core Web Vitals benchmarks, and the reporting models required to build an airtight business case that earns unshakeable executive backing.

Key Takeaways

  • Master the commercial formula for measuring the roi of a website redesign, balancing net conversion revenue and operational savings against project outlay.
  • Discover how technical speed, responsive mobile architecture, and optimised Core Web Vitals accelerate transaction velocity without increasing paid acquisition spend.
  • Quantify indirect dividends such as reduced internal administrative overheads, elevated brand credibility, and mitigated regulatory risks.
  • Implement a disciplined 90-day pre-launch baseline protocol to isolate design-driven commercial gains accurately from seasonal market fluctuations.
  • Protect long-term asset yield by pairing full-lifecycle development engineering with proactive search retention and structured ongoing maintenance.

The Financial Case: Defining Website Redesign ROI Beyond Surface Aesthetics

Executive teams frequently commit capital to digital projects expecting transformative growth, only to judge the finished work through subjective visual preferences. A corporate website isn't a static digital brochure; it's an active commercial engine designed to drive pipeline velocity. Surface refreshes alone never justify significant capital outlays. Successfully measuring the roi of a website redesign requires shifting attention from visual novelty toward quantifiable financial expansion, structural cost reduction, and sustained customer lifetime value.

To grasp how behavioural user experience choices influence commercial returns before committing development resources, watch this strategic breakdown from Nielsen Norman Group:

The Fundamental Formula for Calculating Website Redesign Return

Standardising your economic model simplifies board-level justification. At its core, applying a structured return on investment (ROI) calculation establishes the exact commercial yield produced by your capital allocation:

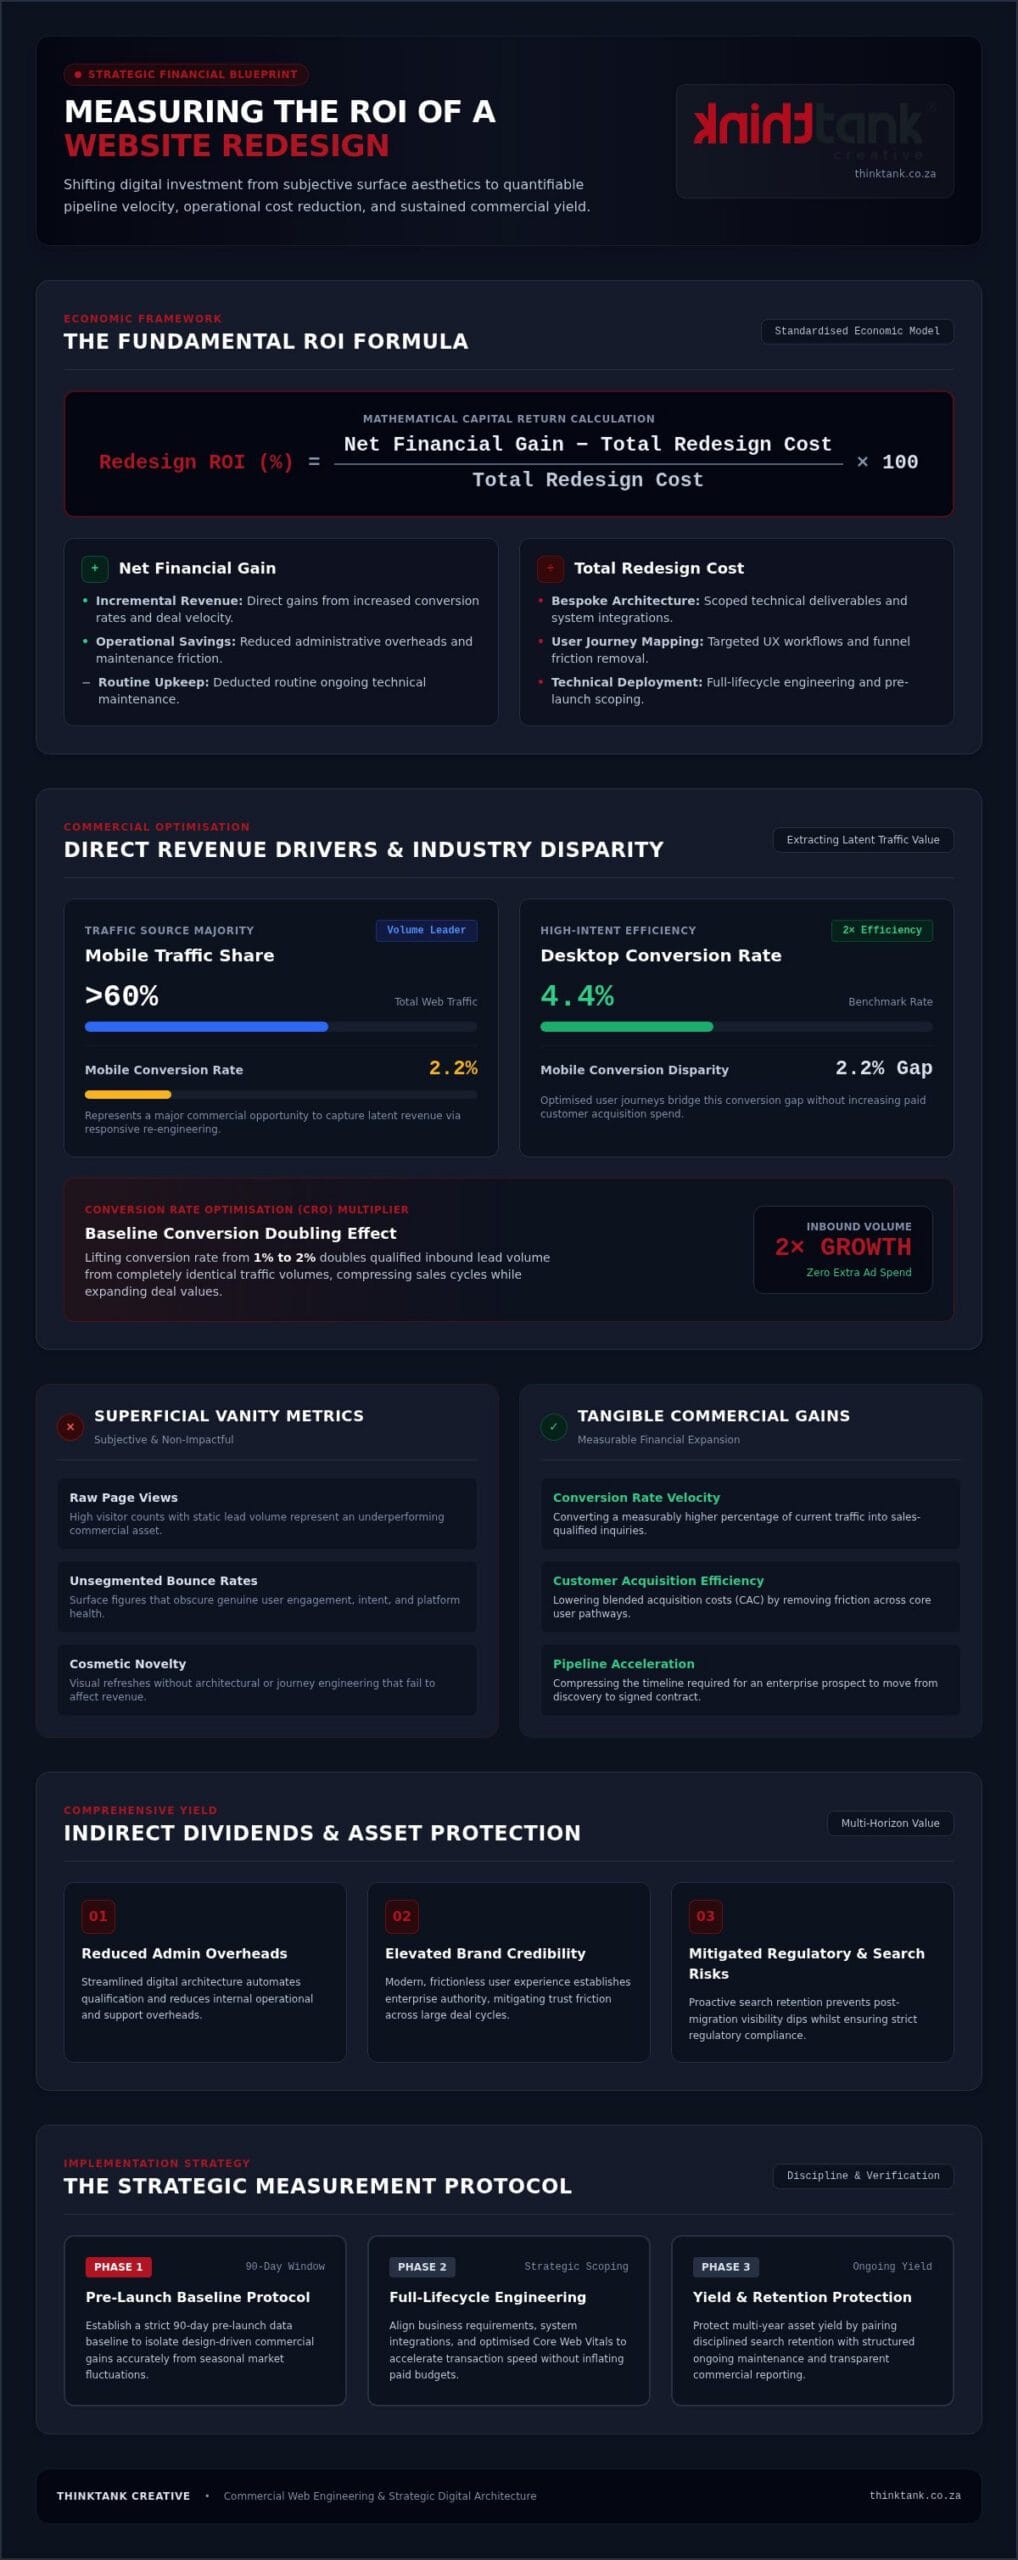
$$text{Redesign ROI (%)} = left(frac{text{Net Financial Gain} - text{Total Redesign Cost}}{text{Total Redesign Cost}}right) times 100$$

Here, net financial gain represents incremental revenue from conversion lifts combined with operational cost reductions, minus routine upkeep. Initial capital expenditure covers bespoke architecture, user journey mapping, and technical deployment. Transparent digital partners establish this outlay systematically. For example, ThinkTank Creative calculates an estimated cost only after conducting an in-depth strategic scoping of business requirements and system integrations, ensuring financial expectations match technical deliverables from day one.

Distinguishing Tangible Commercial Gains from Vanity Metrics

Superficial metrics like raw page views or unsegmented bounce rates obscure genuine business health. An aesthetically pleasing platform that attracts substantial traffic yet yields static lead volumes represents an underperforming asset. Conversely, deliberate UX engineering streamlines user funnels, accelerating lead qualification whilst significantly reducing customer acquisition costs (CAC). When measuring the roi of a website redesign, focus on indicators that alter your commercial ledger:

Direct Revenue Drivers: Measuring Conversion Velocity and Commercial Value

Direct commercial returns materialise when your platform extracts greater transaction value from existing traffic volumes. Global data reveals that over 60% of web traffic originates from mobile devices, yet mobile conversion rates hover around 2.2% compared to 4.4% on desktop environments. This disparity highlights an immediate commercial opportunity. By re-engineering responsive layouts and user pathways, a conversion-focused overhaul captures latent revenue without inflating paid acquisition budgets.

Conversion Rate Optimisation (CRO) and Lead Value Modelling

Lifting your baseline conversion rate from 1% to 2% doubles qualified inbound volume from identical traffic. When modelling pipeline velocity, multiply projected conversion lift against your historical lead-to-close ratio and average contract valuation. Research from Nielsen Norman Group on calculating ROI for design projects demonstrates that structured usability enhancements directly compress sales cycles while expanding deal values. Prioritise improving website user experience across key landing environments to eliminate friction, ensuring visitors navigate seamlessly toward commercial action.

E-commerce Checkout Velocity and Cart Abandonment Reduction

Every unnecessary checkout step or sluggish payment integration actively suppresses transaction completion. Akamai and Portent benchmarks show that a single 1-second delay in mobile loading time degrades conversions by approximately 7%. Conversely, accelerating interface responsiveness and deploying frictionless checkout funnels yields an immediate 5% to 15% rebound in completed sales. Measuring the roi of a website redesign requires tracking this recaptured revenue against prior abandonment baselines:

Organisations deploying bespoke lead generation strategies for South African businesses consistently discover that streamlined digital touchpoints turn casual browsing into measurable pipeline growth. If you're assessing whether your current architecture supports this commercial velocity, a collaborative discovery session with ThinkTank Creative can pinpoint where structural friction restricts your conversion potential.

Indirect Dividends: Operational Efficiencies, Brand Equity, and Search Retention

Revenue expansion tells only half the commercial story. When measuring the roi of a website redesign, indirect dividends represent substantial cost avoidances that protect your operating cash flow. An engineered digital platform reduces internal administrative friction, shields existing organic traffic equity, and establishes the executive credibility required to command premium market pricing.

Quantifying Administrative Time and Technical Support Savings

Legacy websites bleed operational resources through manual interventions. Outdated systems force personnel to re-enter leads manually, answer repetitive customer service queries, and triage frequent technical glitches. Strategic redevelopment replaces these labour sinks with automated CRM synchronisation, structured self-service customer portals, and unified database workflows.

Protecting Organic Capital: Search Engine Visibility Retention

Your existing organic search positions represent hard-earned balance sheet equity. A poorly executed migration can instantly erase keyword rankings, forcing you to replace lost qualified visitors through costly paid search auctions. Protecting this equity demands meticulous pre-launch URL mapping, canonical preservation, and comprehensive 301 redirection frameworks. Engaging specialists in search engine optimisation in South Africa ensures algorithmic equity transitions cleanly into your new environment, defending your customer acquisition pipelines without unexpected ad spend spikes.

Elevating Brand Perception and Corporate Credibility

Visual credibility carries real commercial weight. Landmark findings from the Stanford Web Credibility Research show that 75% of a website's perceived business credibility stems directly from design aesthetics and structural professionalism, whilst 94% of initial user impressions are visual. In high-stakes B2B markets, a tired interface signals institutional stagnation. A bespoke, cohesive digital identity projects market leadership, reassuring institutional buyers and validating premium pricing structures. Measuring the roi of a website redesign means factoring in how elevated corporate perception shortens enterprise sales deliberations and insulates your market share against newer entrants.

Measuring the ROI of a Website Redesign: Strategic 2026 Framework

The Measurement Protocol: Establishing Pre-Launch Baselines and Tracking Windows

Accurate financial attribution collapses if you launch without establishing clean comparative data. Without disciplined pre-launch controls, separating design-led performance improvements from seasonal swings or paid campaign shifts becomes impossible. Measuring the roi of a website redesign requires a staged measurement methodology that tracks system health from early deployment through mature commercial operation.

Step 1 & 2: Pre-Launch Audits and Analytics Calibration

Lock down an uncompromised 90-day baseline before altering a single template. Capture conversion rates by device, assisted conversion paths, organic click-through rates, and exact Core Web Vitals thresholds. Ensure technical readiness by validating Google's responsiveness benchmark, Interaction to Next Paint (INP), targeting 200 milliseconds or less, alongside Largest Contentful Paint (LCP) under 2.5 seconds. Configure server-side tracking and test event triggers to confirm that lead submissions, transaction values, and customer actions record with absolute precision.

Step 3 & 4: 30-Day Technical Stabilisation and 90-Day Performance Reviews

Dedicate the initial 30 days to technical verification. Monitor crawl error logs, indexation coverage, and redirection chains to confirm search bots process the new architecture without friction. Once technical stability is established, use the 90-day review to analyse commercial shifts against your historic baseline. Normalise this data against macroeconomic conditions to isolate genuine conversion velocity gains from external seasonal lift.

Step 5: Annual Total Cost of Ownership (TCO) Assessment

Evaluate your full economic return across a 12-month operating window. Compare incremental top-line revenue and recaptured administrative savings against the total cost of ownership. This calculation must incorporate the initial project investment, established via tailored scoping rather than arbitrary fixed fees, alongside ongoing managed hosting and maintenance. Factoring routine support into lifetime returns confirms whether your platform remains an appreciating asset.

Ready to establish rigorous tracking baselines and deploy a high-yielding digital engine? Partner with an experienced team and request a strategic website consultation with ThinkTank Creative to model your commercial upside.

Maximising Investment Yield: Partnering for Strategic Web Engineering

Maximising capital yield requires treating web redevelopment as a rigorous engineering project rather than an isolated aesthetic sprint. When measuring the roi of a website redesign over multi-year cycles, collaborative strategic alignment consistently outperforms transactional agency engagements. Partnering with a consultative team ensures that every structural layout, code choice, and user interface component actively contributes to conversion volume and operational resilience.

The ThinkTank Creative Methodology: De-risking Digital Capital Investments

Operating across South Africa since 2001, ThinkTank Creative deploys a battle-tested delivery framework that replaces commercial guesswork with structured execution. Our award-winning in-house web and graphic designers work in close harmony with systems developers, methodically balancing intuitive usability with deep back-end stability. Rather than providing arbitrary off-the-shelf quotations, we supply an accurate estimated cost only after conducting thorough strategic scoping aligned with your bespoke organisational goals.

This transparent model guides your investment through a proven five-stage development journey:

Long-Term Support: Protecting Asset Performance Beyond Launch Day

A digital asset begins deprecating the moment it launches unless actively maintained. HTTP Archive benchmarks reveal that only 48% of mobile websites successfully pass all three Core Web Vitals metrics, illustrating how quickly neglected codebases lose their competitive edge. Ongoing maintenance, technical enhancements, and system security updates are vital safeguards that preserve your initial capital efficiency.

Eliminating multi-vendor friction further protects your commercial yield. By uniting bespoke custom website design in South Africa with integrated SEO, search advertising, and branding services, your organisation maintains complete technical cohesion. When measuring the roi of a website redesign across its full lifecycle, continuous optimisation ensures your digital footprint consistently drives pipeline growth. Take the definitive step toward commercial expansion and partner with ThinkTank Creative to engineer an enduring digital asset.

Engineering Your Platform for Measurable Commercial Growth

Capturing the full economic return of a digital overhaul requires looking far beyond cosmetic enhancements. By balancing direct conversion velocity against internal labour savings and search visibility retention, measuring the roi of a website redesign transforms from subjective speculation into an airtight commercial asset. When you establish clean pre-launch baselines and hold development teams accountable to Core Web Vitals, your platform actively compounds balance sheet value.

Securing these dividends demands a committed, highly capable partner. Established across South Africa since 2001, ThinkTank Creative unites award-winning designers with experienced system developers through a proven five-stage methodology. Operating with transparent strategic discovery, our team provides an accurate estimated cost aligned directly with your bespoke operational requirements. We safeguard your technical integrity at every milestone, ensuring your new digital architecture delivers sustained competitive differentiation. Maximise your digital investment with ThinkTank Creative and build a digital flagship engineered for long-term commercial triumph.

Frequently Asked Questions

How long after a website redesign can a business expect to see positive ROI?

B2B organisations and professional service firms typically realise full capital payback within 4 to 14 months following launch. Early indicators such as reduced mobile bounce rates and increased enquiry volume often emerge within the first 60 days. However, long-term commercial returns continue compounding across an average two- to three-year asset lifespan as search rankings solidify and sales teams close leads generated by the streamlined interface.

What is the standard formula used for measuring the roi of a website redesign?

When measuring the roi of a website redesign, the standard economic equation divides net commercial gain by total project expenditure:

$$text{Redesign ROI (%)} = left(frac{text{Net Financial Gain} - text{Total Investment}}{text{Total Investment}}right) times 100$$

Net financial gain combines gross revenue from new conversion lift and quantified operational labour savings, minus ongoing technical maintenance costs. This formula provides executive leadership with a clear percentage yield relative to capital outlay.

Can a business measure website redesign ROI without selling products online?

Yes, non-transactional businesses measure return by tracking pipeline acceleration and lead values. By establishing baseline lead-to-opportunity ratios and average client contract values, each form submission or consultation booking carries a precise monetary figure. A platform that lifts inbound qualified enquiries from 20 to 40 per month delivers quantifiable financial return directly to the sales ledger, even without an integrated transactional payment portal.

Will our organic search traffic drop immediately following a website redesign launch?

Temporary algorithmic fluctuations can occur for two to four weeks whilst search engines crawl and re-index new site structures. However, severe or permanent drops only happen when technical migrations are mishandled. Implementing exhaustive 301 redirection maps, preserving high-performing URL structures, and maintaining on-page metadata ensures search equity transfers intact. Proactive search engine optimisation safeguards existing rankings and quickly accelerates organic visibility post-launch.

How do operational cost savings factor into overall website redesign return calculations?

Operational cost savings represent direct cash preservations that factor alongside top-line revenue gains. When modern system integrations automatically synchronise form submissions with internal CRMs, staff spend fewer administrative hours on manual data entry. Similarly, comprehensive digital self-service resources reduce inbound customer service tickets. Multiplying the hours saved across operational teams by standard labour rates provides a concrete financial saving to add into overall return calculations.

What pre-launch data must be recorded to accurately assess redesign performance later?

Accurate attribution requires capturing an uncompromised 90-day baseline prior to redevelopment. Key metrics include device-specific conversion rates, organic search traffic volumes, top-performing commercial landing pages, and average lead acquisition costs. Additionally, technical benchmarks such as Core Web Vitals (including Interaction to Next Paint and Largest Contentful Paint) must be documented. Without this baseline, proving that subsequent growth stems from design engineering rather than external market shifts is virtually impossible.

How does ThinkTank Creative ensure a website redesign generates measurable commercial value?

ThinkTank Creative applies an established five-stage development framework spanning strategic planning through post-launch delivery and support. Operating nationwide across South Africa since 2001, our award-winning in-house web designers and developers reject generic templates. We calculate an estimated cost only after conducting rigorous commercial discovery, aligning user experience architecture directly with measurable business objectives. This disciplined engineering ensures every deployed asset protects organic equity whilst accelerating transaction velocity.